Creating a reference view in Budgeting
In either the Budgeting Dashboard or the Budget Tree screen, you use a reference view to compare your current working dataset to other dataset views. A reference view can contain up to four reference datasets.
Tip: You configure reference views based on your information needs. For example, you can create a view that is specific to your yearly budget. In this view, you might decide to show variances, units, and accounts. Or you might have a view for monthly forecasting, where variances, units, or account codes are not important.
For best performance, Unifocus recommends selecting one to three reference datasets.
Note: You can create a reference view in either the Budgeting Dashboard or the Budget Tree screen. Your reference view will then be available in both screens.
To create a reference view:
-
Access either the Budgeting Dashboard or the Budget Tree screen.
 Accessing Budgeting Dashboard
-
In the upper-left corner of the screen, select Access your applications (
 ).
).
The menu expands. -
Select Financial > Budgeting.
The Budgeting Dashboard screen appears.
 Accessing Budget Tree
-
In the upper-left corner of the screen, select Access your applications (
 ).
).
The menu expands. -
Select Financial > Budgeting.
The Budgeting Dashboard screen appears.
-
Do one of the following:
To access a specific line from the Budgeting Dashboard:
In the left pane, double-click a line.
The Budget Tree screen opens to the selected line in the budget tree structure. The section of the budget structure appears partially expanded to display all totals at the same level in the tree menu.
To access the Budget Tree screen:
From the Budgeting menu pane, select Budget Tree (
 ).
).
The Budget Tree screen appears.
-
-
From the Reference View drop-down list, select Add or Configure.
The Configure View dialog box appears. -
Select Add New.
The Choose a Name dialog box appears. -
In the View Name field, enter the name for the new view that you are creating.
-
Select Save.
-
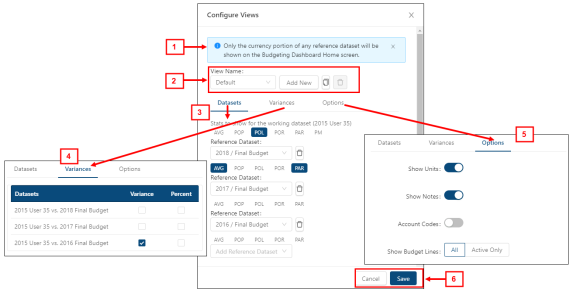
Edit the Configure View dialog box as necessary.
 Click here for field descriptions.

Fields on the Configure View dialog box
# Field Description Notes 1
Note
Informational note:
Only the currency portion of any reference dataset will be shown on the Budgeting Dashboard Home screen.
Read-only.
2 View controls View Name
Select the reference view to work with.
Default: Your most recent view. If this is the first time that you are configuring or editing the view, the default is Default.
Add New
Adds a new reference view.

Clone this view
Creates a clone of the selected reference view. You can then rename the cloned view.

Delete saved view
Deletes the selected reference view.
Button is available only if a view is selected.
Tabs 3
Datasets
Select the stats options to include in the working dataset.

Options include:
-
Delete
-
Stat types
-
AVG—Average = Total Budget Line Revenue or Expense ÷ Total Budget Line Units.
-
POP—Percent of Parent: calculates what percent a line is in relation to its parent line.
-
POL—Percent of Line: calculates what percent one line is of another line.
-
POR—Per Occupied Room: calculates the total monetary amount for the budget line divided by occupied rooms.
-
PAR—Per Available Room: calculates the total monetary amount for the budget line divided by available rooms.
-
PM—Performance Measure.
-
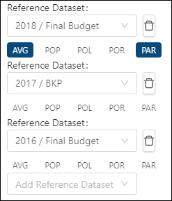
Select stat types for Reference Datasets (1 - 4)

Options include:-
Reference Dataset Selector
-
Delete
-
Stat types:
-
AVG—Average.
-
POP—Percent of Parent: calculates what percent a line is in relation to its parent line.
-
POL—Percent of Line: calculates what percent one line is of another line.
-
POR—Per Occupied Room: calculates the total monetary amount for the budget line divided by occupied rooms.
-
PAR—Per Available Room: calculates the total monetary amount for the budget line divided by available rooms.
-
Notes on stat types:
-
AVG—If you choose to show Average, all lines that do not contain the same type of units will show a blank due to the line not containing units or a mixture of units (hours and KBIs).
-
POL—Percent of Line is configured on the first main screen of the Add Budget Line wizard or on the General tab of the Edit Budget Line dialog box.
-
POR—There needs to be a KBI with a code of TTLRMS to show POR.
-
PAR—There needs to be a KBI with a code of AVAILRMS to show PAR.
-
PM—Although all lines can have performance measures, Unifocus recommends applying performance measures (productivity, FTE or cost of labor percent) to job lines. Performance measures are configured on the second main screen of the Line-specific fields on the Add Budget Line wizard and the Edit Budget Line dialog box.
4
Variances
The Variances tab includes a table with the following columns:
-
Datasets—Read-only list of configured datasets.
-
Variance—Select to see variance between the working and reference dataset.
-
Percent—Select to see the percent variance between the working and reference dataset.
5
Options
Select information to display in the table:
-
Show Units
-
Show Notes
-
Account Codes
-
Show Budget Lines
-
All
-
Active only
-
Type of units are KBI or Hours (Regular and Overtime). Unifocus recommends showing all lines. The Budgeting software indicates whether a line is active or inactive in the working dataset.
6 Buttons Cancel
Closes the dialog box without applying your changes.
Save
Saves your changes and closes the dialog box.
-
-
Select Save.
The dialog box closes, and your changes are saved.