Deep Dive chart configuration in Budgeting Dashboard
This chart shows lines with the top five largest variances from the working dataset to the first comparative dataset. It includes metrics on:
-
Negative—Negative variation.
-
Positive—Positive variance
-
Variance to zero—Flagged variance.
Calculations above are always: working dataset – working dataset.
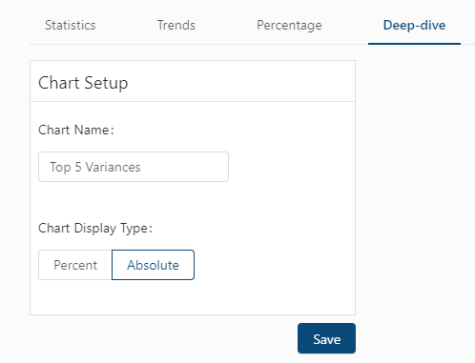
Fields on the Deep-dive configuration tab of the Chart Configuration screen
| Field | Description | Notes |
|---|---|---|
|
Chart Name |
Custom name of the chart. |
Required. Maximum number of characters: 25. This name is displayed on the chart in the Budgeting Dashboard. |
|
Chart Display Type |
Select how to display the largest variances from the working dataset to the first comparative dataset.
|
|
|
Save |
Saves your configuration changes. |
|