Editing the rooms forecast
Use the View/Edit Rooms Forecast task to review, enter, and update the forecast business volumes for all Rooms and Casino market segment KBIs.
-
In the upper-left corner of the screen, select Access your applications (
 ).
).
The menu expands. -
Select Labor> Planning.
The Planning screen appears.
-
Find and run the View/Edit Rooms Forecast task in the Planning menu.
 Working with each view in the Planning menu
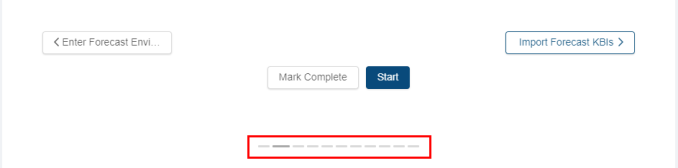
If you are using Quick View:
-
Find the task to update or run by moving through the task sub-screens:
-
Select previous or next task buttons.
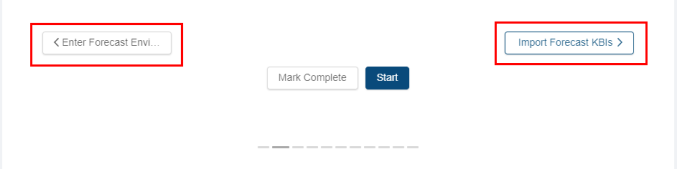
or -
Select the dashed lines of the screen selector.
-
-
When you get to the task, do one of the following:
-
To start or run the task for the first time, select Start.
The selected task opens in either separate tab or in a pane, depending on the task. -
To update the task (if it has already been started), select Update.
-
If you are using List View:
-
Find the task to update, run, or mark complete by scrolling down the screen.
-
When you get to the task, hover the mouse pointer over the status label.
A drop-down list appears.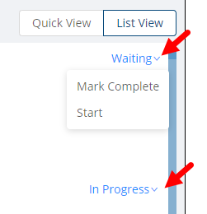
-
From the drop-down list, select one of the following:
-
To start or run the task for the first time, select Start.
The selected task opens in either separate tab or in a pane, depending on the task. -
To update the task (if it has already been started), select Update.
The selected task opens in either separate tab or in a pane, depending on the task.
-
The Edit Rooms Forecast screen appears.
Click here for field descriptions.
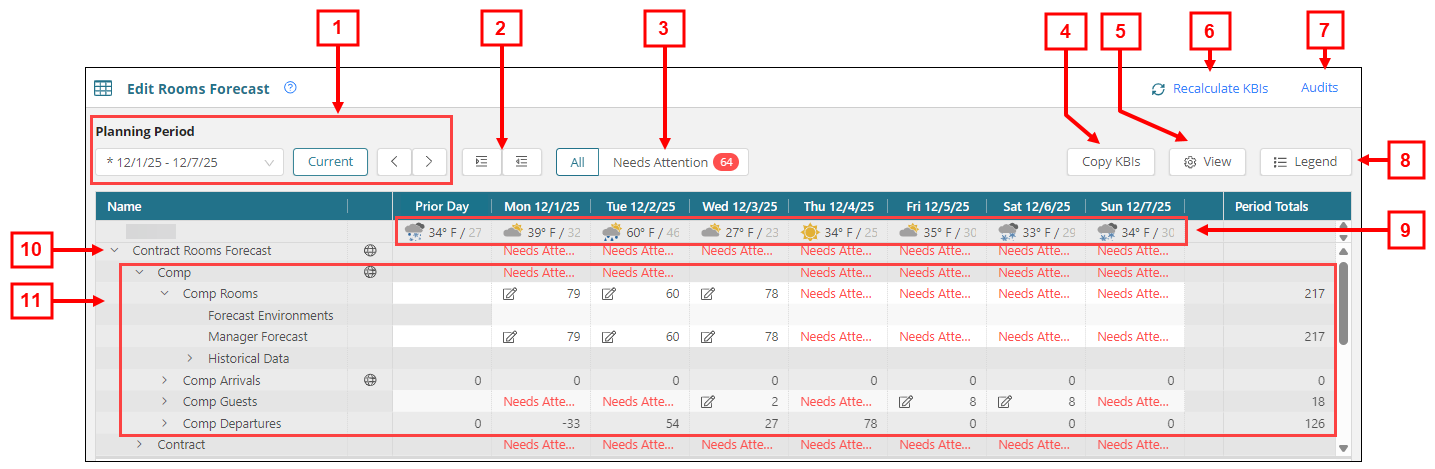
Fields on the Edit Rooms Forecast screen
# Field Description Notes
Controls 1
Planning Period controls
Use the controls to display rooms forecasts for the specified planning period.
Default: Current planning period.
Planning period drop-down
Select a planning period from the drop-down.
Default: Current planning period.
Current
Select the current planning period.
Available only if you navigate away from the current planning period.

Back / Forward
Select the arrows to go to the previous or next planning period.
2

Expand All / Collapse All
Expand or collapse all rows in the table.
3
All / Needs Attention
Filter the table to display all data or only data that requires your attention. A red bubble displays the total number of items that require attention.
4
Copy KBIs
Opens the Copy KBIs dialog box where you can copy manager forecast values for selected input-type market group KBIs from one date range to another. The copy is performed by day of week (for example, Mondays to Mondays) with support for multi-week periods.
Only users with the Edit Rooms Forecast permission can copy KBIs.
5
View menu
Select the check boxes to show or hide:
-
Critical Threshold icons
-
Moderate Threshold icons
-
Daily Totals
Show/Hide Daily Totals is unavailable if Needs Attention is selected.
6
Recalculate KBIs
Select this button to recalculate calculated KBIs after you enter or update KBI data on the screen.
This button appears only if you enter or update KBI data.
7
Audits
View a history of changes to the screen.
8
Legend
Opens the Legend dialog box which displays the following information:
-
 —In recent weeks with the same business conditions, on average the system forecast moderately differed from the actual business volume. Read-only.
 -
 —In recent weeks with the same business conditions, on average the system forecast greatly differed from the actual business volume. Read-only.
 -
 —Needs attention. The system requires more data to generate a forecast. Read-only.
 -
 —Forecast has been edited manually. Read-only.
 -
 —A forecast environment has been applied. Read-only.
 -
 —Data is missing or is incomplete.
Read-only.
Table 9
Weather for the property
The weather forecast is displayed for the location of the selected property. With this information, you can quickly see the weather on a given day so that you can make an educated guess as to the impact that the weather might have on business volumes. The weather forecast data includes the temperature (high and low) and an icon that indicates weather conditions.
Read-only.
10
KBI
Forecast values for the KBI. A number and an icon are displayed for each day. The numbers indicate the number of units (for example, covers), and the icon represents the variance of the system forecast from the actual business volumes.
11
KBI details
Expand each KBI line to see details. The rows in this section define the details and statistics for each KBI.
Not all KBIs include the same details and statistics.
Forecast Environments
Forecast environment applied to the KBI.
System Forecast
The volume forecast generated by the system.
In each cell, the number indicates the system forecast value and the icon indicates the recent average variance of the system forecast to the actual business volume.
Manager Forecast
Manually entered forecast by a manager. If there is no manager forecast, the cell is blank.
Enter a value if you feel that you can better predict the volumes for the day. If there is a manager forecast, the system uses that value instead of the system forecast in schedule calculations.
You cannot enter a negative value.
Historical Data
Expand to view statistics related to forecast accuracy and historical data, including:
-
System Accuracy—During the past four weeks with the same business conditions, on average the system forecast was within X units and Y percent of the actual business volume.
-
Manager Accuracy—During the past four weeks with the same business conditions, on average the manager forecast was within X units and Y percent of the actual business volume.
-
Last Week—Actual business volume for the same day last week.
-
Last Year—Actual business volume for the same day last year.
-
4 Week Average—Average business volume for the same day for the last four weeks.
Read-only.
Daily Totals
Displays total amounts for the day.
Daily Totals appear only if Show Daily Totals is selected in the View menu.
Daily Totals are not displayed in the above image.
-
-
In the table, select the cells and enter or edit the forecast business volumes as necessary.
The screen automatically saves your work.