Maintenance Dashboard screen
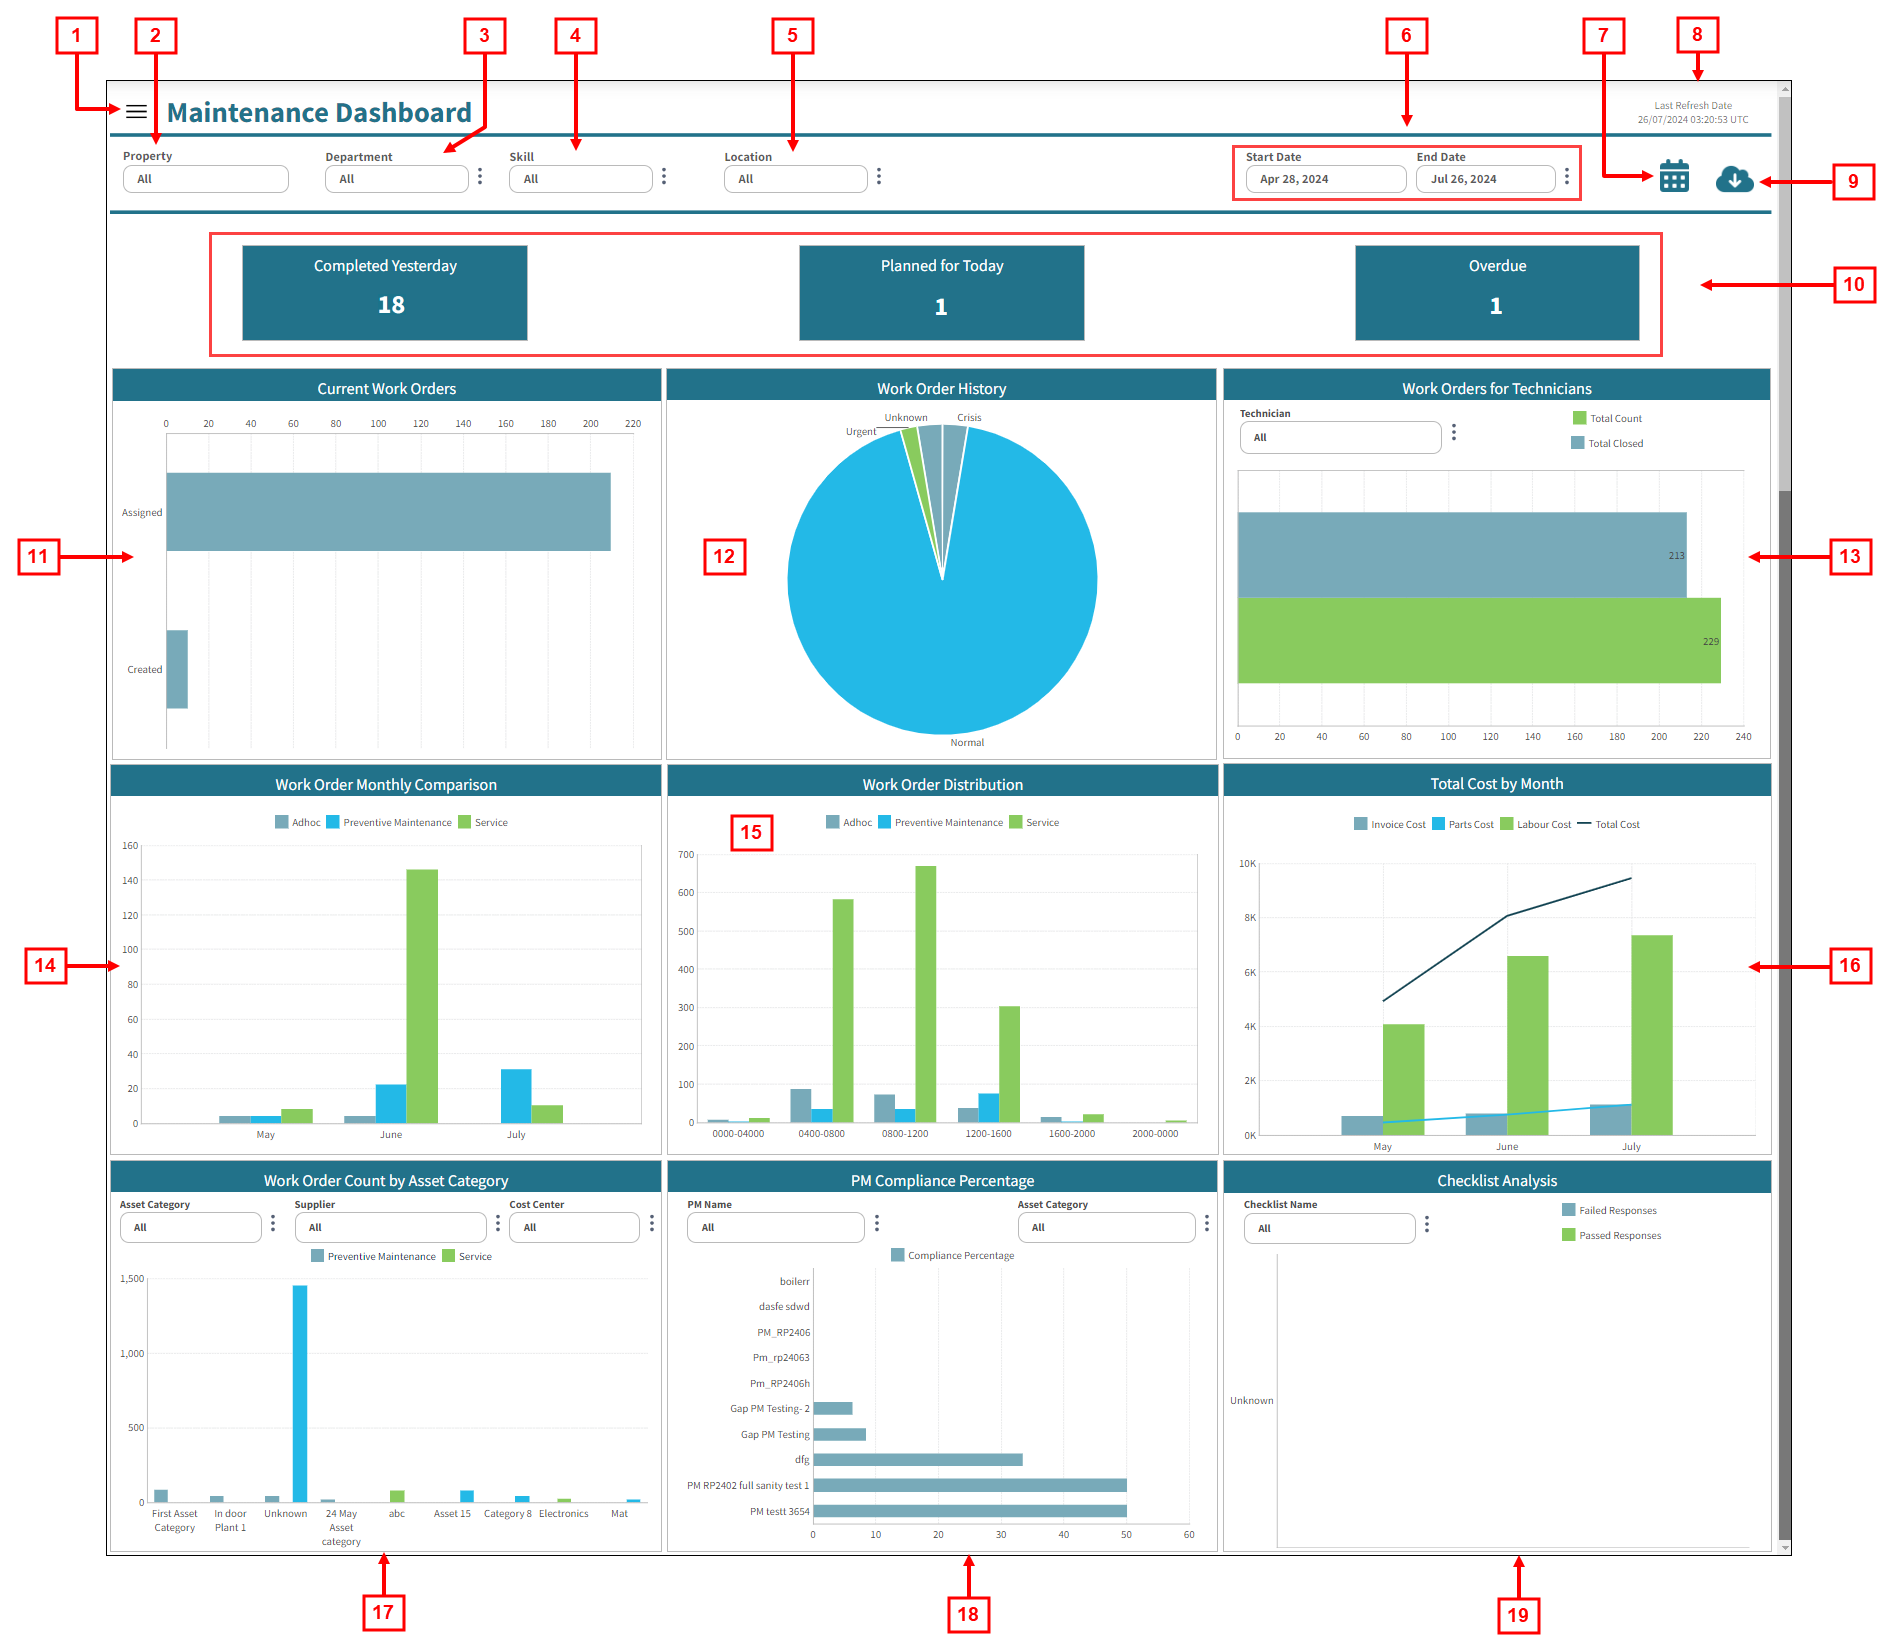
Fields on the Maintenance Dashboard
| # | Field | Description | Notes |
|---|---|---|---|
| Controls | |||
|
1 |
View selector |
Select view options for the Maintenance Dashboard. Options include:
|
Default: Maintenance Dashboard. |
|
2 |
Property |
Select the properties for which you want to view data. |
|
|
3 |
Department |
Use the vertical ellipsis ( |
|
|
4 |
Skill |
Use the vertical ellipsis ( |
|
|
5 |
Location |
Use the vertical ellipsis ( ) icon to specify the location for which to view data. ) icon to specify the location for which to view data. |
|
|
6 |
Start Date / End Date |
Specify the time frame for which to view data. Either select the time frame using the Start Date and End Date fields or use the vertical ellipsis (
|
Default: Last 90 days. |
|
7 |
Notifications |
Provides the following Notifications options:
|
|
|
8 |
Last refresh information |
This read-only text displays the date and time (in the UTC time zone) when data was last refreshed. The data in the Maintenance Dashboard is updated every 5 hours, starting at 00:20 (12:20 AM) UTC, and might not match data in existing reports or in the Maintenance software, depending on when you last made changes in the software. |
Read-only. |
|
9 |
Export |
Opens the Export pane where you can export the current view to one of the following output types:
|
|
| 10 | Operational KPIs | ||
|
Completed Yesterday |
Number of work orders that were completed yesterday. Logic: Completed On Date = Yesterday. |
Read-only. |
|
|
Planned for Today |
Number of work orders that are scheduled to start today. Logic: Schedule Start Date = Today. |
Read-only. |
|
|
Overdue |
Number of work orders that are overdue or late. Logic: Past Schedule End Date > Not Completed Work Orders. Work Order Status = Not Completed/Canceled AND Scheduled End Date < Today. |
Read-only. |
|
| Charts | Click a chart element (bar, pie slice, line, and so on) to open a table with more details and information related to that specific data point in the chart. | ||
|
11 |
Current Work Orders |
Status for all work orders based on when the data was last run. |
|
|
12 |
Work Order History |
History of all work orders based on priority and closed date. |
|
|
13 |
Work Orders for Technicians |
Total Work Order Count (Assigned) vs. Total Work Orders Completed. If multiple technicians are selected, the software shows the addition of work order count and completed count. Data is based on the closed date. |
|
|
14 |
Work Order Monthly Comparison |
Comparison of work order count as per different sources, that is, PM, Service, and Ad hoc. Data is based on the closed date. |
|
|
15 |
Work Order Distribution |
Work order count based on time range and created date. |
|
|
16 |
Total Cost by Month |
Total monthly costs for the work orders for Labor, Part, and Invoice. Data is based on closed date. |
|
|
17 |
Work Order Count by Asset Category |
The total number of work orders by asset category. This chart provides a visual representation of maintenance efforts, categorizing and quantifying work orders by asset type to aid in resource allocation and strategic planning. You can apply different filters, such as Suppliers and Cost Centers, to gain additional insights into your data. The information is based on various sources: ad hoc, Service, and Preventive Maintenance. |
|
|
18 |
PM Compliance Percentage |
Ratio of completed compliant work orders to total preventive maintenance work orders. A work order is deemed compliant if it is completed on time and originates from scheduled preventive maintenance activities. This chart aids in enhancing operational efficiency and asset management by ensuring that maintenance tasks meet established standards and timelines. Calculation: Number of compliant work orders / Total number of work orders. |
|
|
19 |
Checklist Analysis |
Total number of passed and failed responses from maintenance checklists, providing a comprehensive measurement of compliance and identifying areas in need of improvement. |
|

 )—Opens the Set Up Notifications pane where you can schedule a notification.