Selecting the screen view in Maintenance Dashboard
There are two different views of work order data: a view of charts and a table view of data.
-
From the main menu on the left side of the screen, select the Maintenance (
 ) option. The Work Order Console appears.
 -
From the menu on the left, select the Analytics (
 ) option.
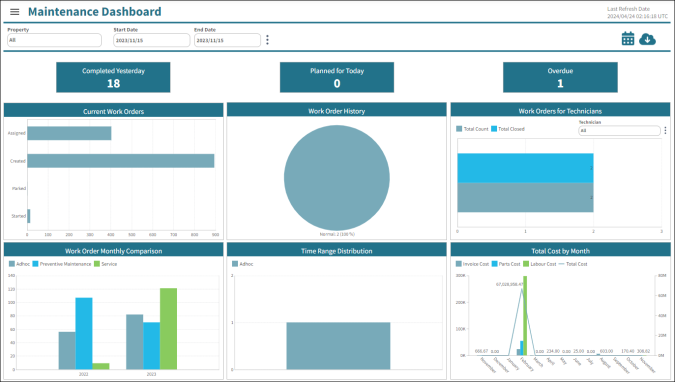
The Analytics screen opens to the chart view of the Maintenance Dashboard.
-
From the menu (
 ) in the upper-left corner of the screen, select one of the following options:
-
Work Orders—The default view of the screen displays charts with work order information for your selected properties.
-
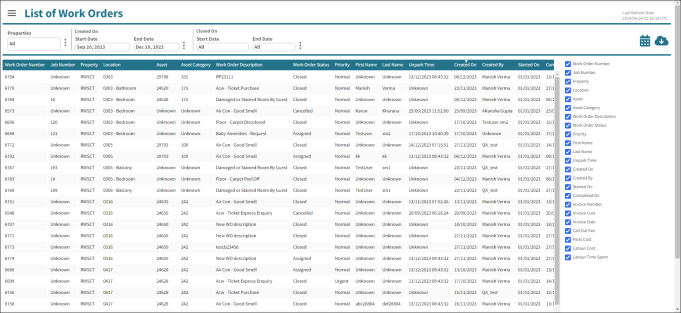
List of Work Orders—This view displays a table of work order data for your selected properties. Use the pane at the right side of the screen to select the columns that appear in the table.
-