Benchmarking tab
Fields on the Benchmarking tab
| # | Field | Description | Notes |
|---|---|---|---|
| Controls | |||
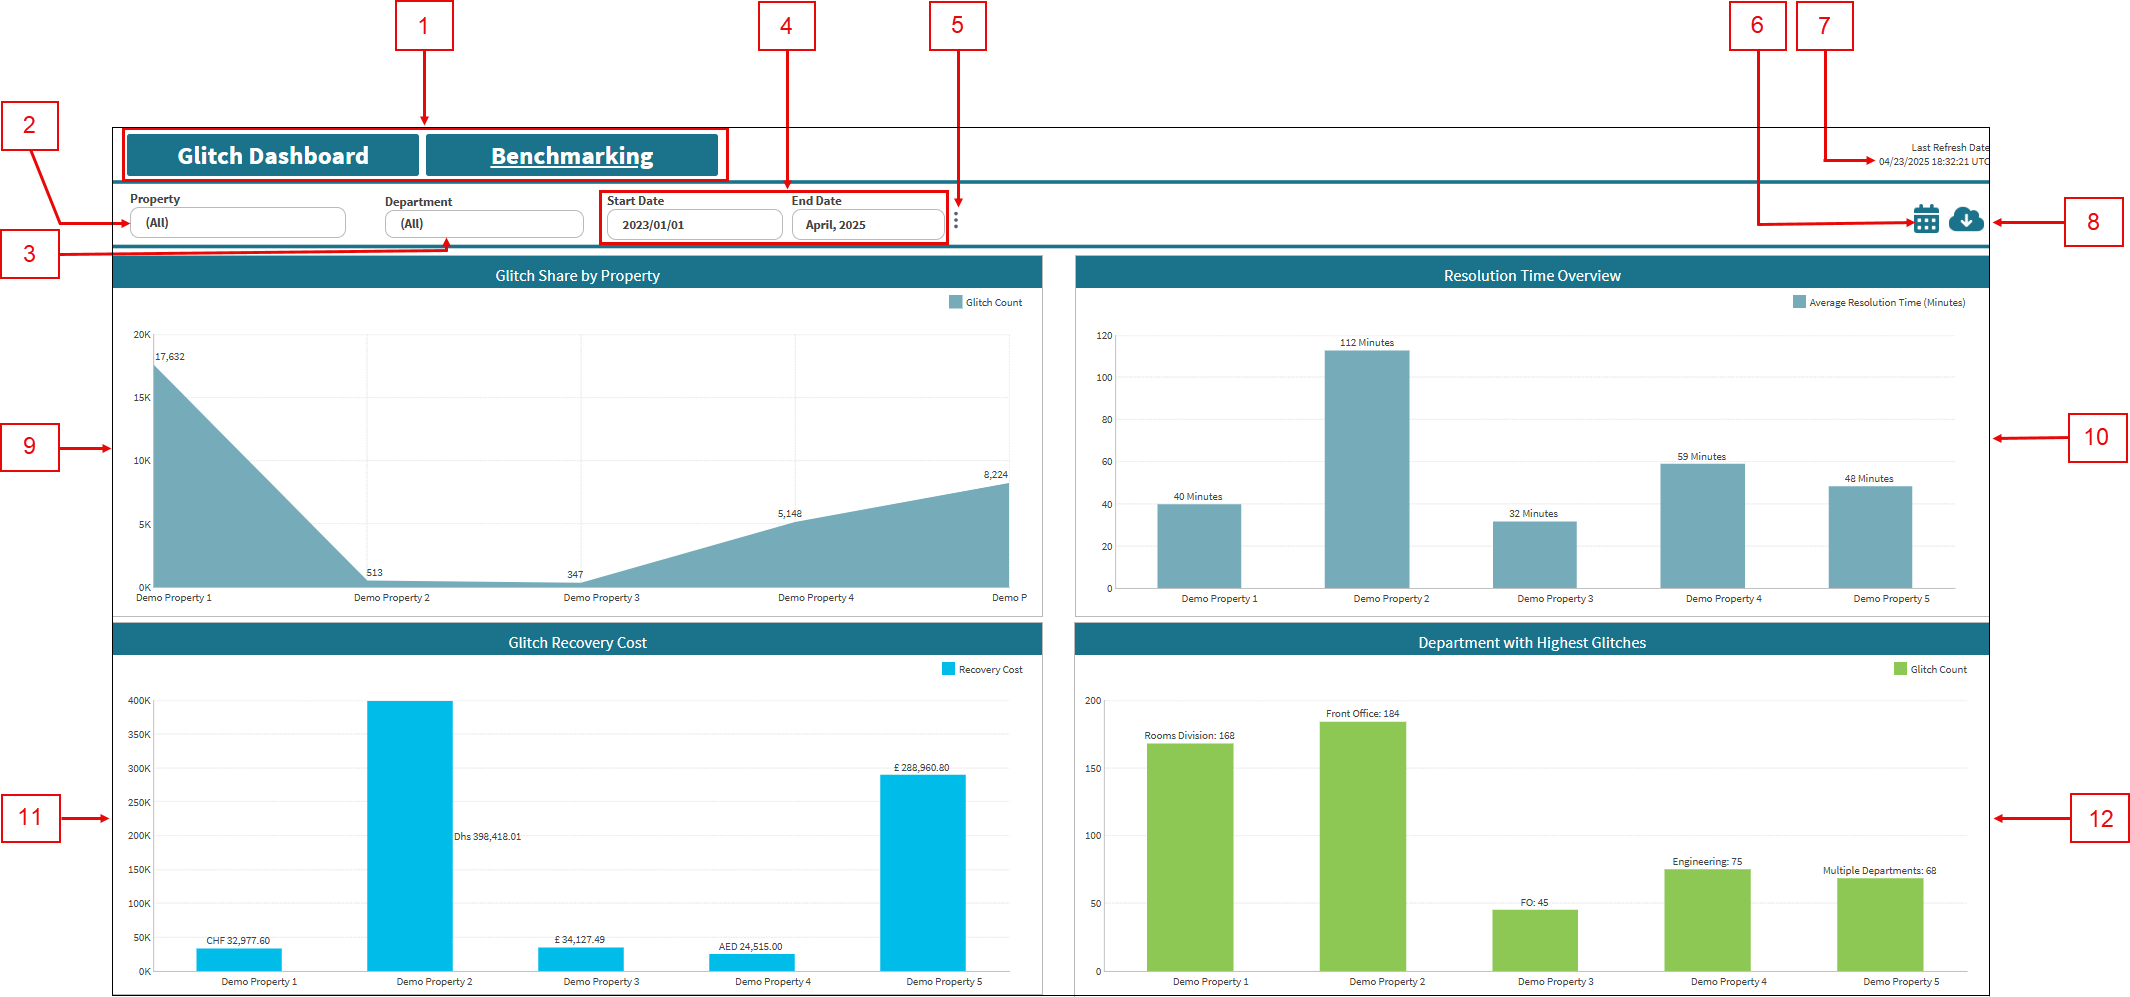
| 1 |
Tabs:
|
|
|
|
2 |
Property |
Select the properties for which to view data. |
|
|
3 |
Department |
Select the department for which to view data. |
|
|
4 |
Start Date / End Date |
Specify the time frame for which to view data. |
Default: Last 90 days. |
|
5 |
Token value |
Displays additional options:
|
|
|
6 |
Notifications |
Provides the following Notifications options:
|
|
|
7 |
Last refresh information |
This read-only text displays the date and time (in the UTC time zone) when data was last refreshed. The data in the Service Dashboard is updated every 5 hours, starting at 00:20 (12:20 AM) UTC, and might not match data in existing reports or in the Service software, depending on when you last made changes in the software. |
Read-only. |
|
8 |
Export |
Opens the Export pane where you can export the current view to one of the following output types:
|
|
| Charts | Click a chart element (bar, pie slice, line, and so on) to open a table with more details and information related to that specific data point in the chart. | ||
|
9 |
Glitch Share by Property |
Total number of glitches reported by each property. With this information, you can monitor trends and gain a clear understanding of glitch reporting patterns across properties. |
|
|
10 |
Resolution Time Overview |
Average time (in minutes) each property takes to resolve glitches. Comparing resolution times helps teams benchmark performance, highlight operational strengths, and encourage the adoption of efficient practices across properties. |
|
|
11 |
Glitch Recovery Cost |
Total recovery costs spent by each property in resolving glitches. This information supports cost benchmarking and helps identify outliers, enabling data-driven decisions to manage spending and optimize resource allocation. |
|
|
12 |
Department with Highest Glitches |
Department within each property that logged the highest number of glitches. This information helps to identify departments that might need additional training or process improvements. |
|
