Housekeeping Dashboard screen
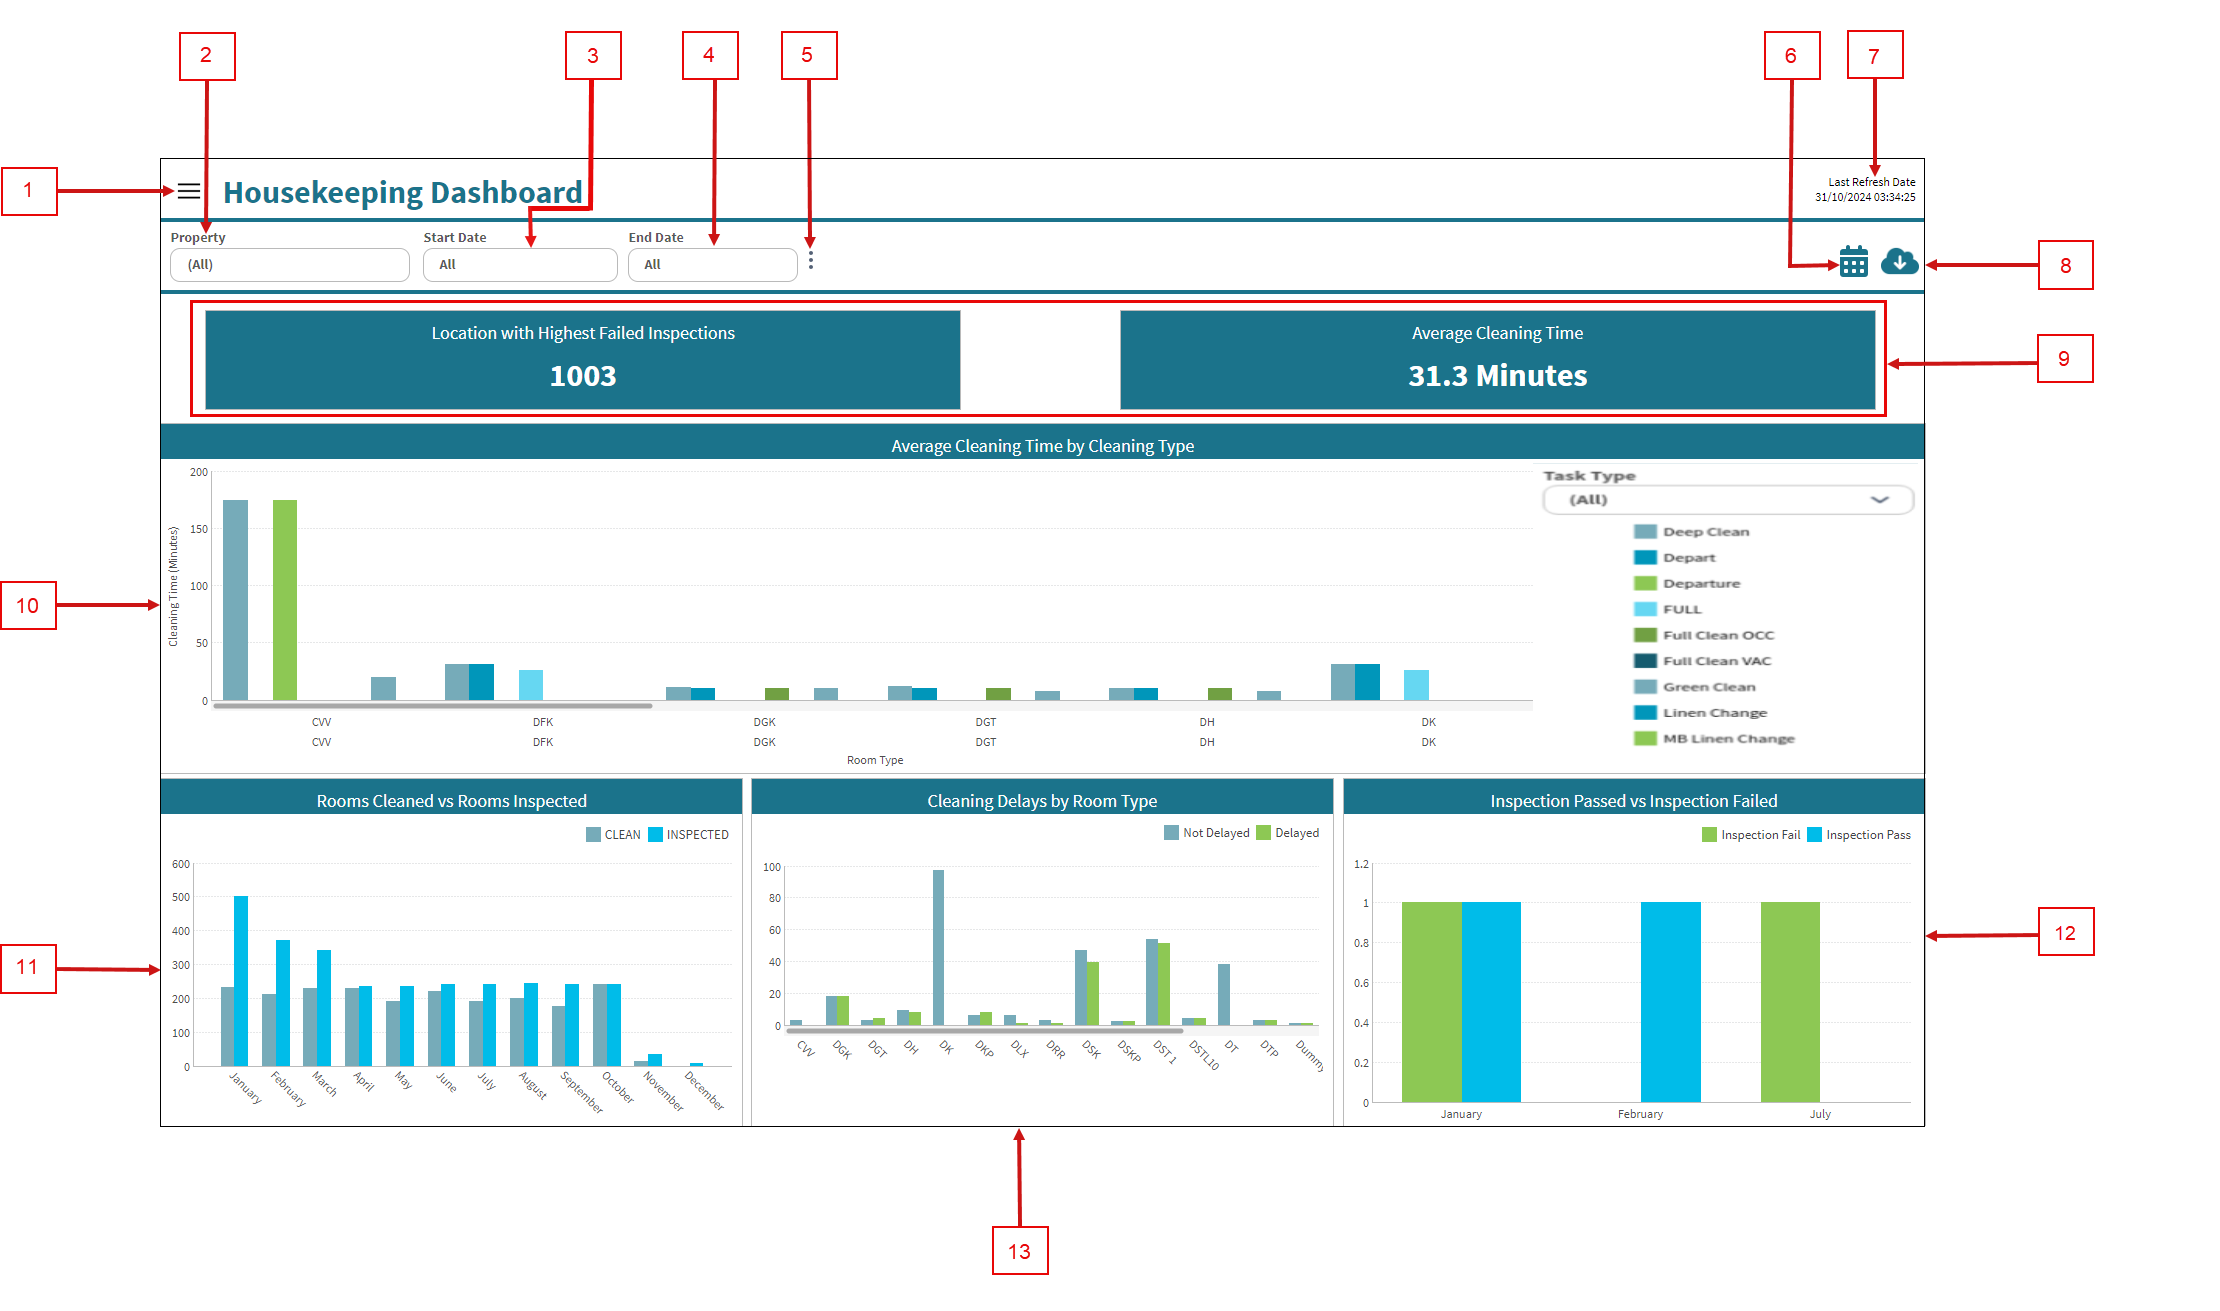
Fields on the Housekeeping Dashboard
| # | Field | Description | Notes |
|---|---|---|---|
| Controls | |||
|
1 |
View selector |
Select view options for the Housekeeping Dashboard. Options include:
|
Default: Housekeeping Dashboard. |
|
2 |
Property |
Select the properties for which to view data. |
|
|
3 |
Start Date |
Specify the time frame for which to view data. |
|
| 4 | End Date |
Specify the time frame for which to view data. |
|
| 5 |
Vertical Ellipsis |
Displays additional options:
|
|
|
6 |
Notifications |
Provides the following Notifications options:
|
|
|
7 |
Last refresh information |
This read-only text displays the date and time (in the UTC time zone) when data was last refreshed. The data in the Housekeeping Dashboard is updated every 5 hours, starting at 00:20 (12:20 AM) UTC, and might not match data in existing reports or in the Housekeeping software, depending on when you last made changes in the software. |
Read-only. |
|
8 |
Export |
Opens the Export pane where you can export the current view to one of the following output types:
|
|
| 9 | Operational KPIs | ||
|
Location with Highest Failed Inspections |
Shows the location with the most failed inspections within the selected date range. |
Read-only. |
|
|
Average Cleaning Time |
Shows the average time spent on cleaning tasks across selected properties within the chosen date range. |
Read-only. |
|
| Charts | Click a chart element (bar, pie slice, line, and so on) to open a table with more details and information related to that specific data point in the chart. | ||
|
10 |
Average Cleaning Time by Cleaning Type |
Shows the average cleaning time for different cleaning tasks across room types within the selected date range. This information allows you to analyze efficiency for each task and room type, making it easier to identify areas for improvement. The chart display the following data values:
|
|
|
11 |
Room Cleaned vs Rooms Inspected |
Shows the number of rooms cleaned compared with the number of rooms inspected within the selected date range. This information helps to ensure that inspection rates are in line with cleaning activities, supporting consistent quality control. The chart displays the following data values:
|
|
| 12 | Inspection Passed vs Inspection Failed |
Shows the number of passed and failed inspections, helping identify areas that need more training or improvement. The chart displays the following data values:
|
|
| 13 |
Cleaning Delays by Room Type |
Shows the delays in cleaning for each room type within the selected date range. This information helps you to identify areas where cleaning is taking longer than expected, allowing for better resource allocation and timely issue resolution. The chart displays the following data values:
|
|

