Details chart configuration in Budgeting Dashboard
This page defines fields in the Statistics chart configuration section, which corresponds with the Details section on the Budgeting Dashboard.
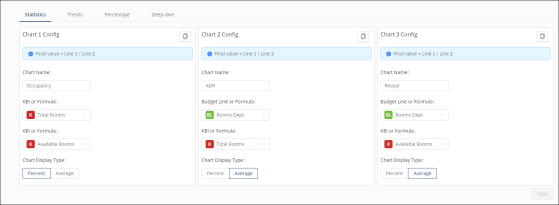
This first section comprises three side-by-side tiles. Chart 1 allows for the configuration of one to two KBIs or Formulas. Chart 1 is meant to display only units. For example, Chart 1 might be configured to divide line 1 by line 2 and then display that value as a percentage or as an average. Or it allows you to pick a single KBI so that the corresponding chart on the Budgeting Dashboard displays the actual unit count. Charts 2 and 3 allow for the configuration of a Budget Line or Formula and a KBI or Formula. For example, you can use these charts to get an average of a budget line (which will always be a monetary amount) divided by the KBI (which is in units).
Tip: If both line options are selected in Chart 1, the calculation is always units ÷ units. If both line options are selected in Charts 2 and 3, the calculation is always currency ÷ units.
Fields on the Statistics configuration tab of the Chart Configuration screen
Note: Statistics configuration is available only for Operating Budget licenses.
| Field | Description | Notes |
|---|---|---|
|
Chart Name |
Custom name of the chart. In the field, type a meaningful name so that you will be able to easily identify the purpose of the chart. For example, Total Covers, F&B Rev, Avg Check. |
Required. Maximum number of characters: 25. This name is displayed on the chart in the Budgeting Dashboard. |
|
Copy from Default Chart Setup |
Copies the chart configuration that is in the Default Chart Setup line. |
This option is available for all line configurations except for the Default Chart Setup line. The default chart setup will be inherited upon first configuration for all lines in the Budgeting Dashboard. The only time this should need to be used is when you have decided to override your existing configuration with the default configuration. |
|
Calculation formula |
Displays the final calculation for the chart. If both KBI or Formula and Budget Line or Formula fields are populated, the top line is divided by the bottom line. If only the top field is populated, only the value is displayed in the corresponding chart. |
Required. |
|
KBI or Formula (for chart 1) Or Budget Line or Formula (for charts 2 and 3) |
KBI or Formula—Select the KBI or Formula for the top line.
Budget Line or Formula—Select the budget line or add a formula.
A K indicates that a specific KBI has been selected. For more information on building formulas, seeBuilding a formula. |
Required. |
|
KBI or Formula (for all charts |
The KBI or Formula by which the top Budget Line Formula (or KBI or Formula for Chart 1) is divided.
|
Optional. If you select a KBI or formula from this bottom field, the chart displays information based on the calculation of lines. If you do not select KBI or formula, the chart displays only information for the top field (KBI or Formula OR Budget Line or Formula). |
| Chart Display Type |
How the chart will be displayed on the Budgeting Dashboard:
|
When only one of the two options (KBI, Budget Line or Formula) is selected, Unifocus recommends that you choose Average to show in a numerical format. |
|
Save |
Applies your selections and updates the Budgeting Dashboard. |
|
