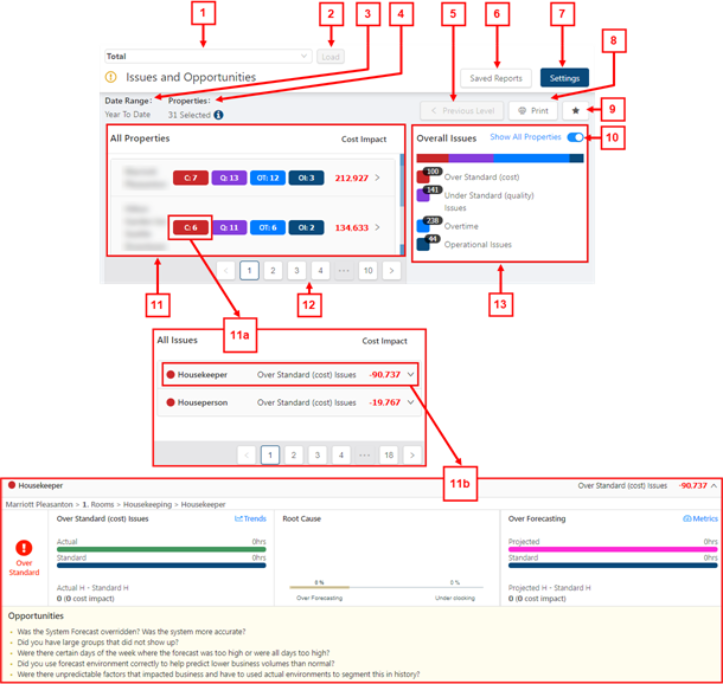
Issues and Opportunities screen of Labor Dashboard
The Issues and Opportunities screen displays the potential causes and cost impact of various issues among properties. Issues may include cost, quality, overtime, and operational issues.
Notes: When you first access the Issues and Opportunities screen, the Settings dialog box appears. You must select Settings options before you can use the Issues and Opportunities screen. For information about configuring the screen, see Setting up Labor Dashboard.
|
# |
Field |
Description |
Notes |
|---|---|---|---|
|
1 |
Breadcrumb / labor structure selector |
Displays the organization level (within the labor structure) for which information is displayed. To view a different organization level, select the options in the drop-down lists and select Load. |
|
|
2 |
Load |
Loads your selection from the breadcrumb and updates the information displayed on the screen. |
This button is only available for selection after you change the organization level in the bread crumb field. |
|
3 |
Date Range |
Displays the date range for which data is displayed on the screen. The Date Range is specified in the Settings dialog box for the Labor Dashboard. |
Read-only. |
|
4 |
Properties |
Displays the number of selected properties. Hover the mouse pointer over the information icon ( |
Read-only. |
|
5 |
Previous Level |
Moves you up one level in the labor structure. For example, if you are view a job, selecting the Previous Level button takes you to the department. |
|
|
6 |
Saved Reports |
Opens a list of saved reports that you can view. |
For information about saved reports, see Report views. |
|
7 |
Settings |
Opens the Settings dialog box for the Labor Dashboard where you can change the settings for the screen. |
For information about configuring the screen, see Setting up Labor Dashboard. |
|
8 |
|
Creates a printable version of the report. |
For more information, see Exporting and printing the Labor Dashboard screens |
|
9 |
Save New Report |
Opens the Save New Report dialog box where you can save the current view as a favorite. |
For information about saved reports, see Report views. |
|
10 |
Show All Properties |
Displays issues and impact for all properties. A page selector appears at the bottom of the screen. Use this to view more properties. |
By default, the screen displays only Top Critical Properties. |
|
11 |
Properties table |
Lists the property name, number of issues of each type, and the total cost impact at the property. Select a property to view a breakdown of issues at that property. Issue types include:
|
By default, the properties table displays only Top Critical Properties. This can be changed to include all properties by pressing the Show All Properties slider. Use the page selector below the table to view more properties. |
|
11a |
Issues by Job table |
Displays the number of issues within each job category and their cost impact. Select any cell in a row to view the Issues by Job breakdown. |
|
|
11b |
Issues by Job breakdown |
Displays the cause of the issue and offers suggestions for improvement. Displays data from the Trends and Metrics dashboards. View these screens in more detail by clicking the links on this screen. |
For more information, see the following: |
|
12 |
Page selector |
Move between pages to view additional properties. |
Appears if the Show All Properties toggle switch is turned on. |
|
13 |
Overall Issues |
Shows the total number of each type of issue at all of the properties displayed in the report. Issue types include:
|
By default, the Overall Issues section displays the total number of issues at Top Critical Properties. This can be changed to include all properties by pressing the Show All Properties slider. |
 Over Standard (cost)—Number of jobs (at the property) where actual hours exceed standard hours outside of the configured threshold for over-scheduling.
 Under Standard (quality) Issues—Number of jobs (at the property) where standard hours exceed actual hours outside of the configured threshold for under-scheduling.
 Overtime—Number of jobs (at the property) where overtime (OT) hours exceed the configured threshold for overtime.
  Operational Issues—Number of jobs (at the property) where underlying issues impact operations.
 Over Standard (cost)—Occurs when the worked hours are greater than the standard hours outside of the configured threshold. This threshold is typically configured as 3% to 5% in most installations. For example, if the actual hours are more than 5% greater than the standard hours, the Cost indicator is red and displays the count of the number of jobs with this condition.
 Under Standard (quality) Issues—Occurs where the worked hours are less than the standard hours outside of the configured threshold. This threshold is typically configured as 3% to 5% in most installations. For example, if the actual hours are more than 5% less than the standard hours, the Quality indicator is purple and displays the number of jobs with this condition.
 Overtime—Occurs the percentage of actual overtime (OT) hours exceeds the configured threshold for overtime. This threshold is configured based on the company's policy for acceptable use of OT. For example, if the threshold is set to 3% and more than 3% of worked hours are OT hours, then the OT indicator is blue and displays the number of related of jobs with this condition.
 Operational Issues—Occurs when the variance between worked and standard hours is within the configured threshold, but underlying issues exist that put a strain on operations or put quality at risk.