Viewing data on the KBI Projections screen
-
In the upper-left corner of the screen, select Access your applications (
 ).
).
The menu expands. -
Select Financial > Budgeting.
The Budgeting Dashboard screen appears.
-
In the Budgeting menu pane, select KBI Projections (
 ).
).
The KBI Projections screen appears.

Fields on the KBI Projections screen
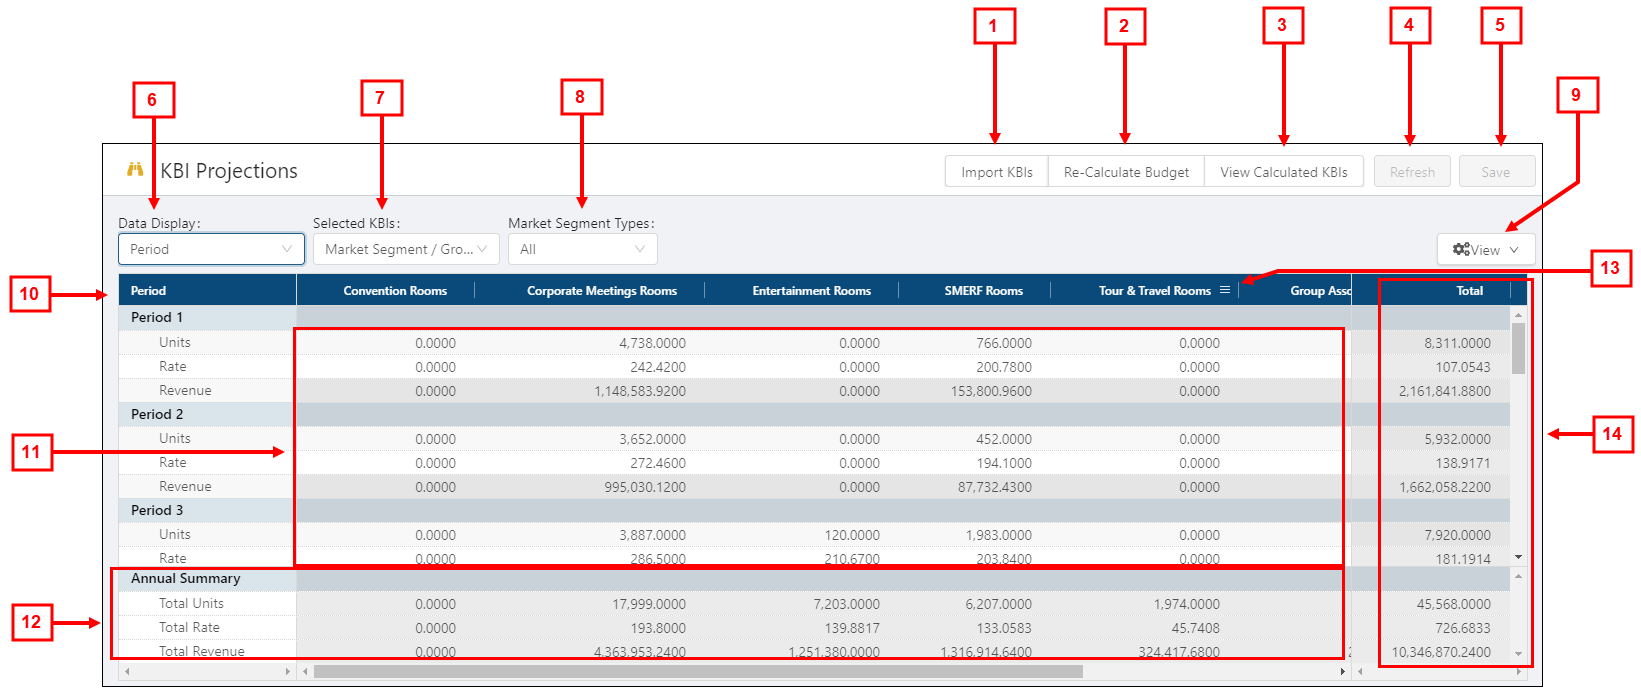
| # | Field | Description | Notes |
|---|---|---|---|
|
|
Controls | ||
|
1 |
Import KBIs |
Imports KBIs from an external system. |
This option is available only if the Import Budget Forecast KBIs interface is configured. |
|
2 |
Re-Calculate Budget |
Recalculates your working dataset. |
|
|
3 |
View Calculated KBIs |
Opens the View Calculated KBIs dialog box where you can view all calculated KBIs. |
|
|
4 |
Refresh |
Contacts the database, pulls data from the last time you published, and then reverts the budget to the state of the last publication. Important: Use only this refresh button for the budgeting operation. Selecting the browser refresh button will refresh all open RMS tabs, which could result in unsaved data or lost changes. For more information, see Refreshing screens |
This button is available only if you have made changes to the screen. |
|
5 |
Save |
Saves your changes to the database. |
This button is available only if you have made changes to the screen. |
|
6 |
Data Display |
Selects the time frame for which to view data. Options include:
|
By default, the Period view is selected and opens to the first division or property sorted in alphabetical order. Your selected data display is saved for your session, so if you go to another screen and then return to the KBI Projections screen, the data is displayed in the previously selected time frame. |
|
7 |
Selected KBIs |
Select market groups that contain one or more KBIs to display. |
Both the default option and the drop-down list options depend on your user security permissions to see KBIs. |
|
8 |
Market Segment Types |
Select available market segment types to display on the screen. You can select all market segment types or all segments types. |
Default: All. If you do not have access to market segments, this field does not appear. |
|
9 |
View |
Selects which units, rates, or revenue appear in the table. Selected check boxes display the row; cleared check boxes hide the row. Options include:
|
|
|
|
Table | The table view is customizable and depends on your selections from the fields at the top of the screen. |
|
|
10 |
Time frame for data display |
The information in the table appears based on the selected data display type. |
|
|
11 |
KBIs and market segment types |
KBI and market segment amounts based on your display selections. If you enter values in these cells, the amount is distributed appropriately for your selected data display. For example, if you are using an annual data display and enter a value of 365 (based on a 365-day calendar year), the value is distributed as 1 per day in a daily data display. |
Column headers correspond with configured KBIs. |
|
12 |
Annual Summary |
Displays annual summary of Total Units, Total Rate, and Total Revenue. |
Read-only. The information that appears in the section depends on your selection from the View menu ( |
|
13 |
Column filters |
Control, customize, and filter the information for table columns.
For more information, seeUsing column settings in the KBI Projections screen. |
Column filters are saved only for your current session. They are not saved for other sessions or other users. |
|
14 |
Total |
This section displays the totals for all KBIs and market segments selected in the filtered view based on the selected data view (Annual, Quarter, Period, or Daily). |
Read-only. |
This page covers the following tasks:
Selecting the data for the screen
Selecting the data for the screen
-
From the Data Display drop-down list, select the time frame for which to view data in the table. Options include:
-
Annual
-
Quarter
-
Period
-
Daily
-
-
From the Selected KBIs drop-down list, select market groups that contain one or more KBIs to display.
-
From the Market SegmentTypes drop-down list, select either one or all market segment types to view.
Selecting the rows to display
-
Above the table, select View (
 ).
). -
From the drop-down list, select one or multiple options:
All
Hours
Rates
Costs
The table updates based on your selections.
Expanding and collapsing rows
-
To expand a row, click the expand arrow (
 ).
). -
To collapse a row, click the expand arrow (
 ).
).
Filtering the table
Several tables in the Budgeting software feature column settings. To use these settings, do the following:Hover your mouse pointer over a column heading.
A settings icon ( ) appears.
Select the column settings icon (
 ).
).
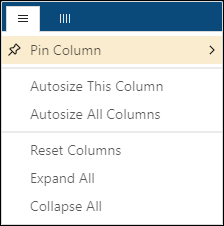
The column settings menu appears.
The menu includes two sections:Column settings (
 )
)Column filters (
 )
)Note: The column filters (
 ) are not available in RMS.
Select the desired options for settings (
 ):
):Pin Column—Pin the column to the left or right.
Autosize All Columns—Automatically set the optimal width for all columns in the table.
Reset Columns—Reset columns to their original width and position.
Expand All—Expands all sub-columns and -rows.
Collapse All—Collapses all sub-columns and -rows.
When you are done, select outside of the column settings menu.
Note: Column settings are saved only for your current session. The screen reverts to the default column selections when you sign out of the Unifocus software. Unifocus recommends keeping the default column selections.

