Glitch Dashboard tab
Fields on the Glitch Dashboard tab
| # | Field | Description | Notes |
|---|---|---|---|
| Controls | |||
|
1 |
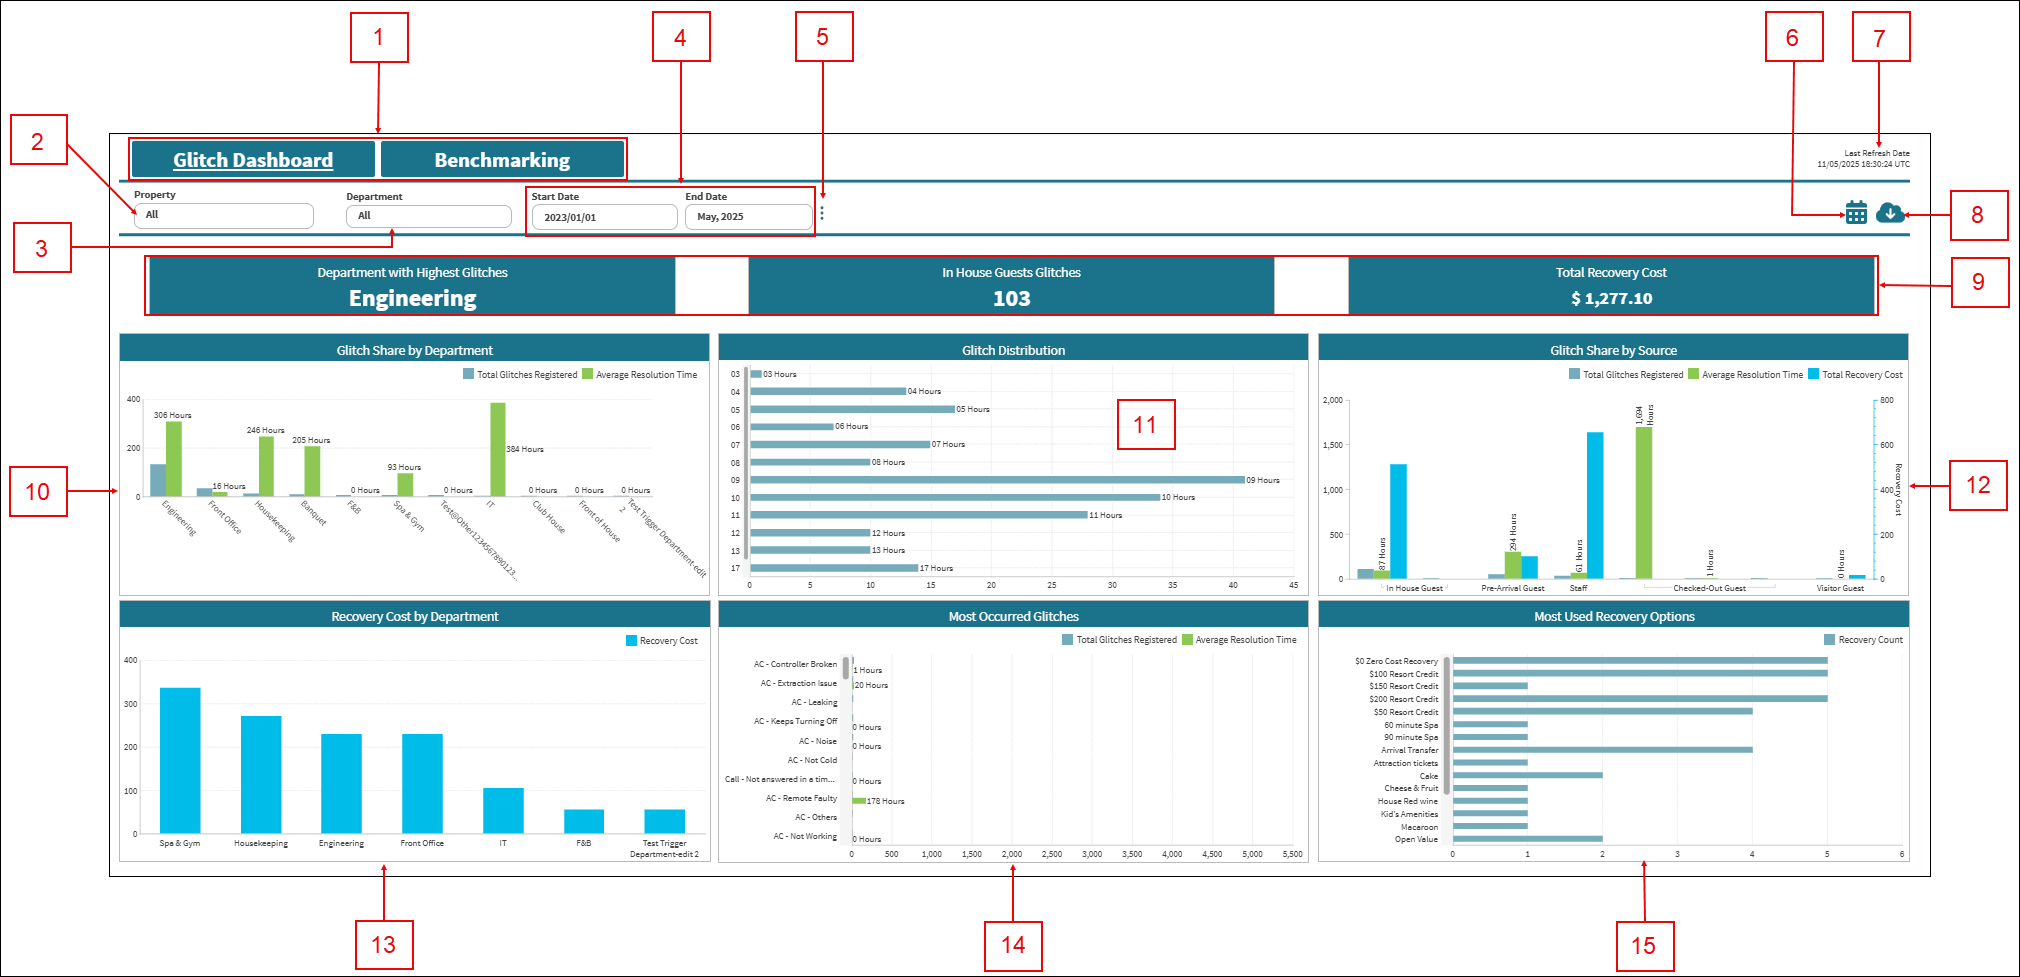
Tabs:
|
|
Default: Glitch Dashboard. |
|
2 |
Property |
Select the properties for which to view data. |
|
|
3 |
Department |
Select the department for which to view data. |
|
|
4 |
Start Date / End Date |
Specify the time frame for which to view data. |
Default: Month to date. |
|
5 |
Additional options |
Displays additional options:
|
|
|
6 |
Notifications |
Provides the following Notifications options:
|
|
|
7 |
Last refresh information |
This read-only text displays the date and time (in the UTC time zone) when data was last refreshed. The data in the Glitch Dashboard is updated every 5 hours, starting at 00:20 (12:20 AM) UTC, and might not match data in existing reports or in the Service software, depending on when you last made changes in the software. |
Read-only. |
|
8 |
Export |
Opens the Export pane where you can export the current view to one of the following output types:
|
|
| 9 | Operational KPIs | ||
|
Department With Highest Glitches |
Department with the highest number of glitches or complaints registered within the selected date range. With this information, you can quickly identify which department is facing the most issues, allowing you to focus on resolving and reducing these glitches. |
Read-only. |
|
|
In House Guests Glitches |
Total number of glitches registered from in-house guests within the selected department and date range. This metric is crucial for monitoring and addressing in-house guest complaints promptly to enhance guest satisfaction. |
Read-only. |
|
|
Total Recovery Cost |
Total cost spent to recover and resolve guest complaints within the selected date range and department. This information helps you understand the financial impact of resolving glitches, aiding in budgeting and cost management. |
Read-only. |
|
| Charts | Click a chart element (bar, pie slice, line, and so on) to open a table with more details and information related to that specific data point in the chart. | ||
|
10 |
Glitch Share By Department |
Comparison of the total glitches registered in each department and the corresponding average resolution time. This comparison shows you which departments have the most glitches and how long it takes to resolve them, helping in process improvements and resource allocation. |
|
|
11 |
Glitch Distribution |
Distribution of glitches registered throughout a 24-hour cycle. By identifying the busiest hours of the day for glitches, you can optimize staff scheduling and ensure adequate support during peak times. |
|
|
12 |
Glitch Share By Source |
Total glitches registered via different sources (in-house guests, visitor guests, checked-out guests, pre-arrival guests, and staff), corresponding average resolution time, and total recovery cost spent in each source. This chart provides insight into the origins of glitches and helps you address specific sources more effectively. |
|
|
13 |
Recovery Cost By Department |
Total cost spent to recover and resolve guest complaints in each department within the selected date range. With this information, you can better understand the financial distribution of recovery costs across departments, aiding in better financial planning and management. |
|
|
14 |
Most Occurred Glitches |
Most frequently occurring glitch descriptions and the corresponding average resolution time. Identifying common glitch types and their resolution times helps in prioritizing training and process improvements to reduce these issues. |
|
|
15 |
Most Used Recovery Options |
Most used recovery options to resolve guest complaints within the selected date range and department. This information provides insight into the most effective recovery strategies, allowing you to streamline processes and improve guest satisfaction. |
|
