Benchmarking tab
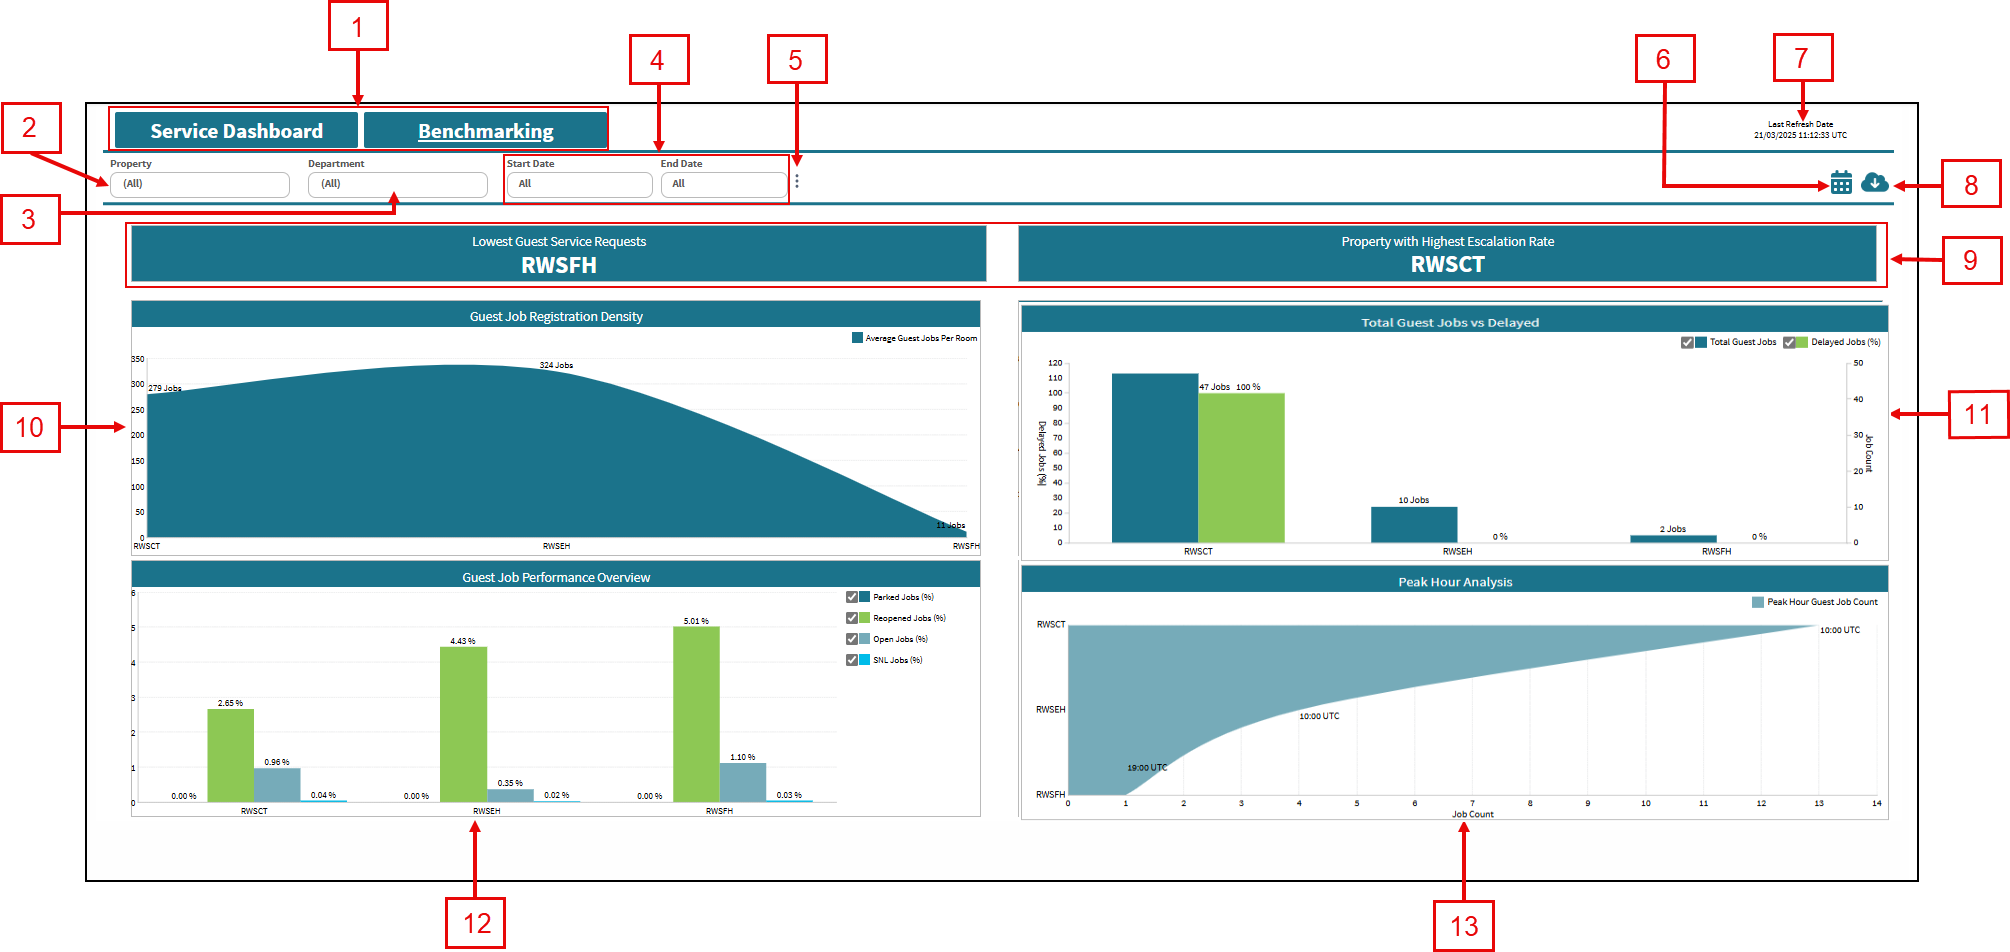
Fields on the Benchmarking
| # | Field | Description | Notes |
|---|---|---|---|
| Controls | |||
| 1 |
Tabs:
|
|
|
|
2 |
Property |
Select the properties for which to view data. |
|
|
3 |
Department |
Select the department for which to view data. |
|
|
4 |
Start Date / End Date |
Specify the time frame for which to view data. |
Default: Last 90 days. |
|
5 |
Token value |
Displays additional options:
|
|
|
6 |
Notifications |
Provides the following Notifications options:
|
|
|
7 |
Last refresh information |
This read-only text displays the date and time (in the UTC time zone) when data was last refreshed. The data in the Service Dashboard is updated every 5 hours, starting at 00:20 (12:20 AM) UTC, and might not match data in existing reports or in the Service software, depending on when you last made changes in the software. |
Read-only. |
|
8 |
Export |
Opens the Export pane where you can export the current view to one of the following output types:
|
|
| 9 | Operational KPIs | ||
|
Lowest Guest Service Requests |
Property with the least number of guest jobs registered relative to its total guest rooms. With this information, you can quickly identify property that may not be fully utilizing the Unifocus Service product, allowing you to address potential inefficiencies in job reporting and guest engagement. |
Read-only. |
|
|
Property with Highest Escalation Rate |
With this information, you can quickly identify the property with the highest percentage of escalated guest jobs, allowing you to address frequent service issues and implement process improvements to reduce escalations and enhance service resolution. |
Read-only. |
|
| Charts | Click a chart element (bar, pie slice, line, and so on) to open a table with more details and information related to that specific data point in the chart. | ||
|
10 |
Guest Job Registration Density |
Displays the average number of jobs registered per guest room for each property. |
|
|
11 |
Total Guest Jobs vs Delayed |
Comparison of total guest jobs vs delayed jobs, showing the proportion of overall guest jobs and the percentage of jobs that exceeded the time limits. |
Select or clear the checkbox in the legend section to hide or show the data points on the widget. |
|
12 |
Guest Job Performance Overview |
This chart provides insight into job handling efficiency across properties, using four key performance metrics:
|
Select or clear the checkbox in the legend section to hide or show the data points on the widget. |
|
13 |
Peak Hour Analysis |
Displays the busiest hour of the day for each property. It highlights peak times for better staffing and resource allocation. | |
