Service Dashboard tab
Fields on the Service Dashboard tab
| # | Field | Description | Notes |
|---|---|---|---|
| Controls | |||
|
1 |
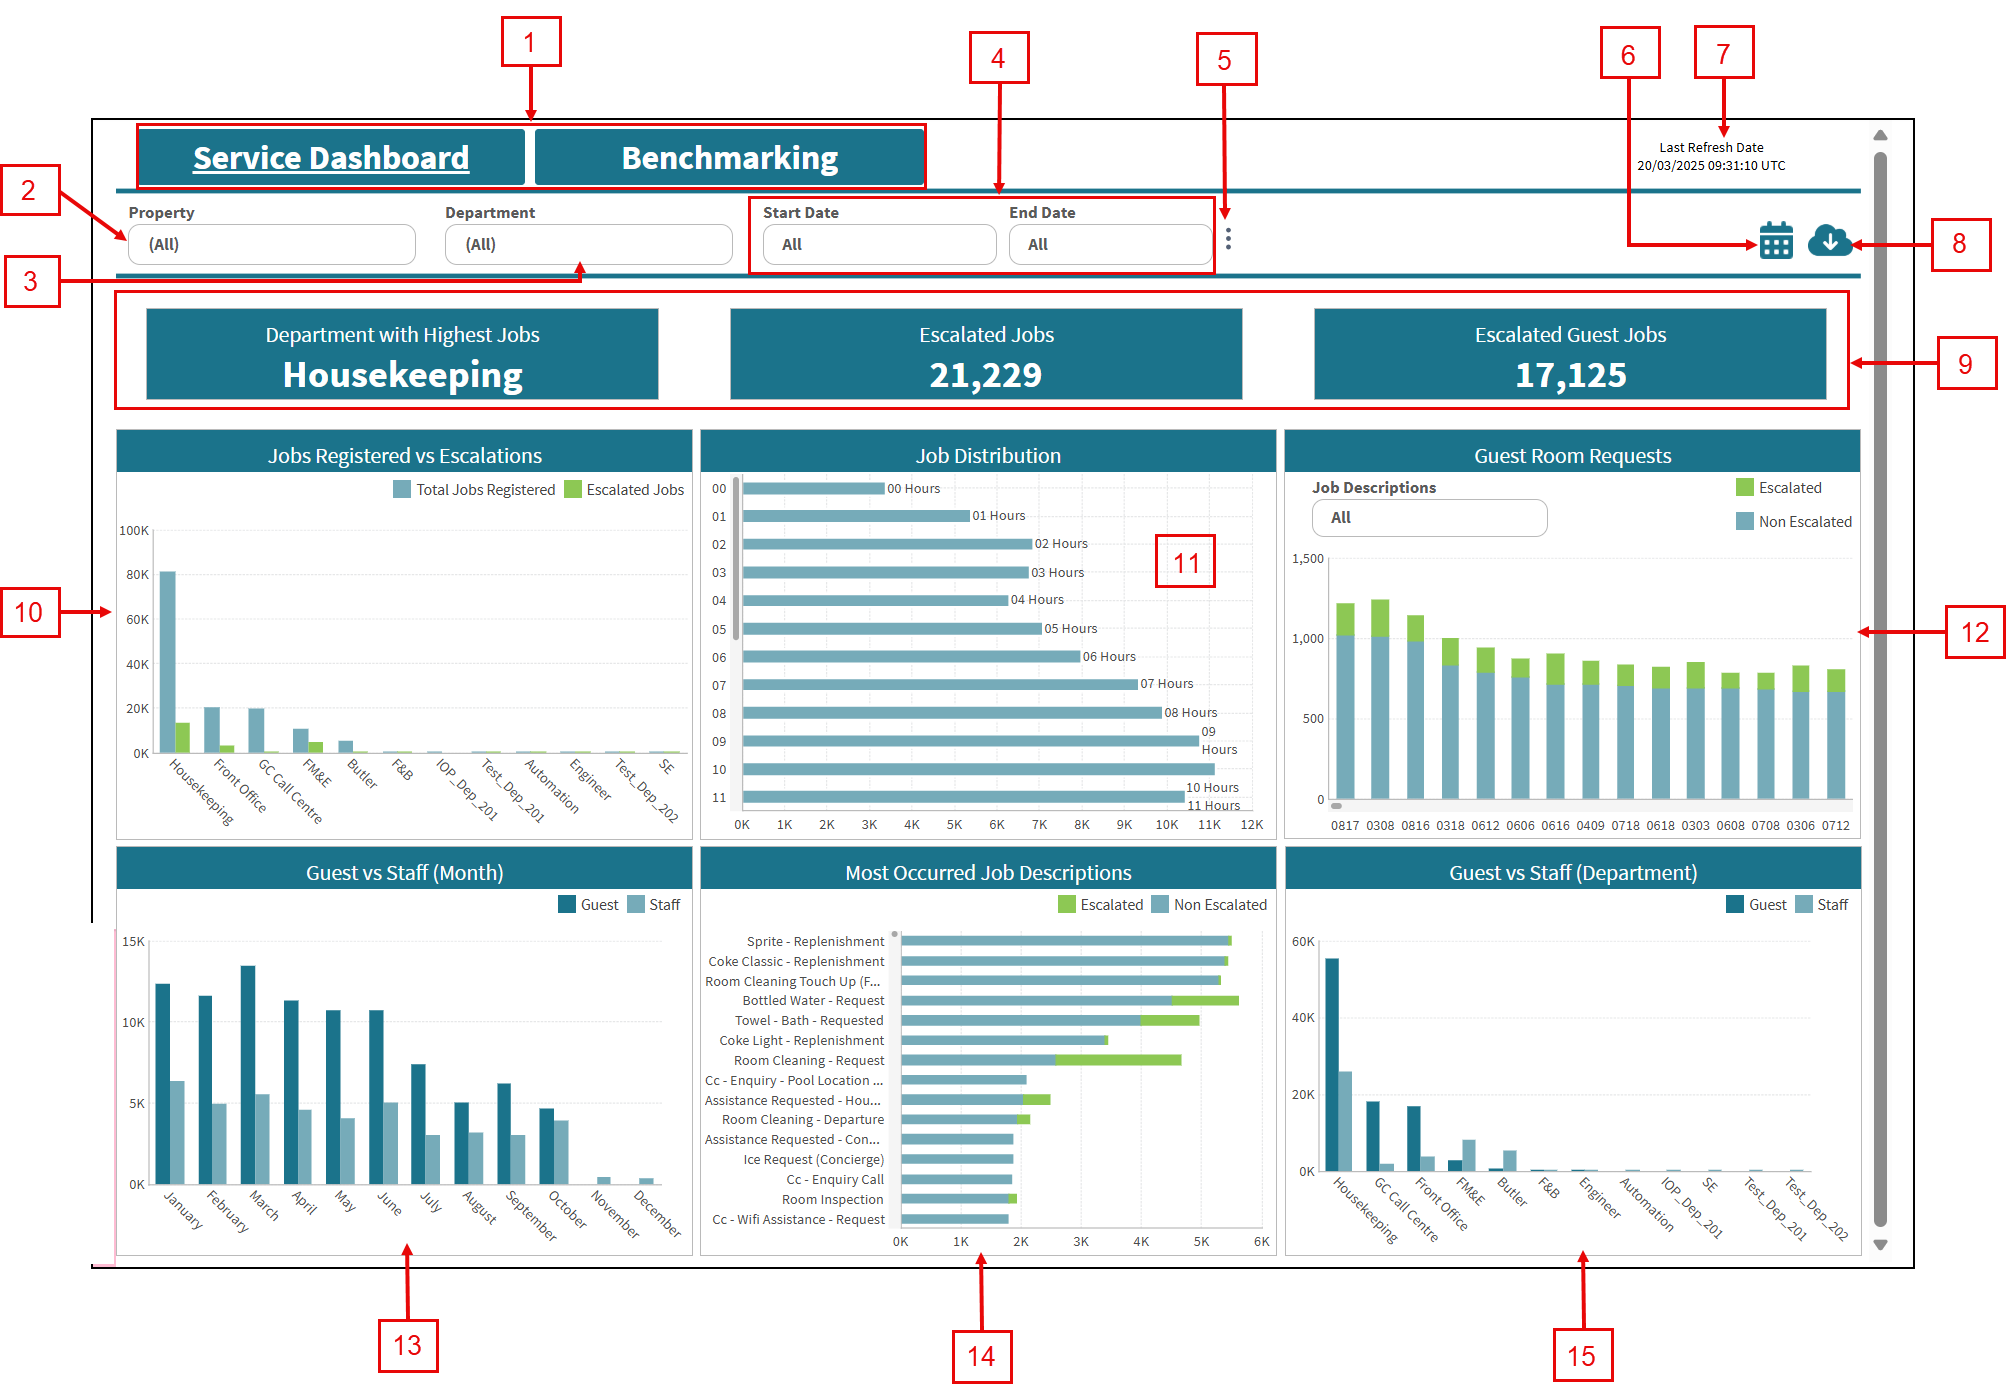
Tabs:
|
|
Default: Service Dashboard. |
|
2 |
Property |
Select the properties for which to view data. |
|
|
3 |
Department |
Select the department for which to view data. |
|
|
4 |
Start Date / End Date |
Specify the time frame for which to view data. |
Default: Last 90 days. |
|
5 |
Toke value |
Displays additional options:
|
|
|
6 |
Notifications |
Provides the following Notifications options:
|
|
|
7 |
Last refresh information |
This read-only text displays the date and time (in the UTC time zone) when data was last refreshed. The data in the Service Dashboard is updated every 5 hours, starting at 00:20 (12:20 AM) UTC, and might not match data in existing reports or in the Service software, depending on when you last made changes in the software. |
Read-only. |
|
8 |
Export |
Opens the Export pane where you can export the current view to one of the following output types:
|
|
| 9 | Operational KPIs | ||
|
Department With Highest Jobs |
Department with the highest number of jobs registered within the selected date range. With this information, you can quickly identify which department is handling the most work, allowing you to allocate resources more efficiently. |
Read-only. |
|
|
Escalated Jobs |
Total number of escalated jobs within the selected department and date range. This metric is crucial for understanding the areas where issues are being escalated and might require additional attention or support. |
Read-only. |
|
|
Escalated Guest Jobs |
Total number of escalated jobs requested by guests during the selected period. This information helps in monitoring guest satisfaction and pinpointing areas where guest requests often lead to escalations. |
Read-only. |
|
| Charts | Click a chart element (bar, pie slice, line, and so on) to open a table with more details and information related to that specific data point in the chart. | ||
|
10 |
Jobs Registered vs Escalations |
Comparison of the total jobs registered to the corresponding escalations across different departments. This comparison allows you to see the escalation rate and effectiveness of issue resolution within each department. |
|
|
11 |
Job Distribution |
Distribution of jobs registered throughout a 24-hour cycle. By identifying the busiest hours of the day, you can optimize staff scheduling and ensure enough coverage during peak times. |
|
|
12 |
Guest Room Requests |
Number of guest room requests, distinguishing between escalated and non-escalated requests. This chart provides insight into the volume and nature of guest requests, helping to improve service delivery and guest satisfaction. |
|
|
13 |
Guest vs Staff (Month) |
Monthly comparison of jobs handled by guests versus staff. With this information, you can track trends over time and understand the balance between guest requests and staff-initiated jobs. |
|
|
14 |
Most Occurred Job Descriptions |
Most frequently occurring job descriptions and their corresponding escalation rates. Identifying common job types and their escalation rates helps in prioritizing training and process improvements to reduce escalations. |
|
|
15 |
Guest vs Staff (Department) |
Department-level comparison of jobs handled by guests versus staff. This information helps you to better understand departmental workloads and the distribution of guest- versus staff-initiated jobs, aiding in better resource allocation and management. |
|
