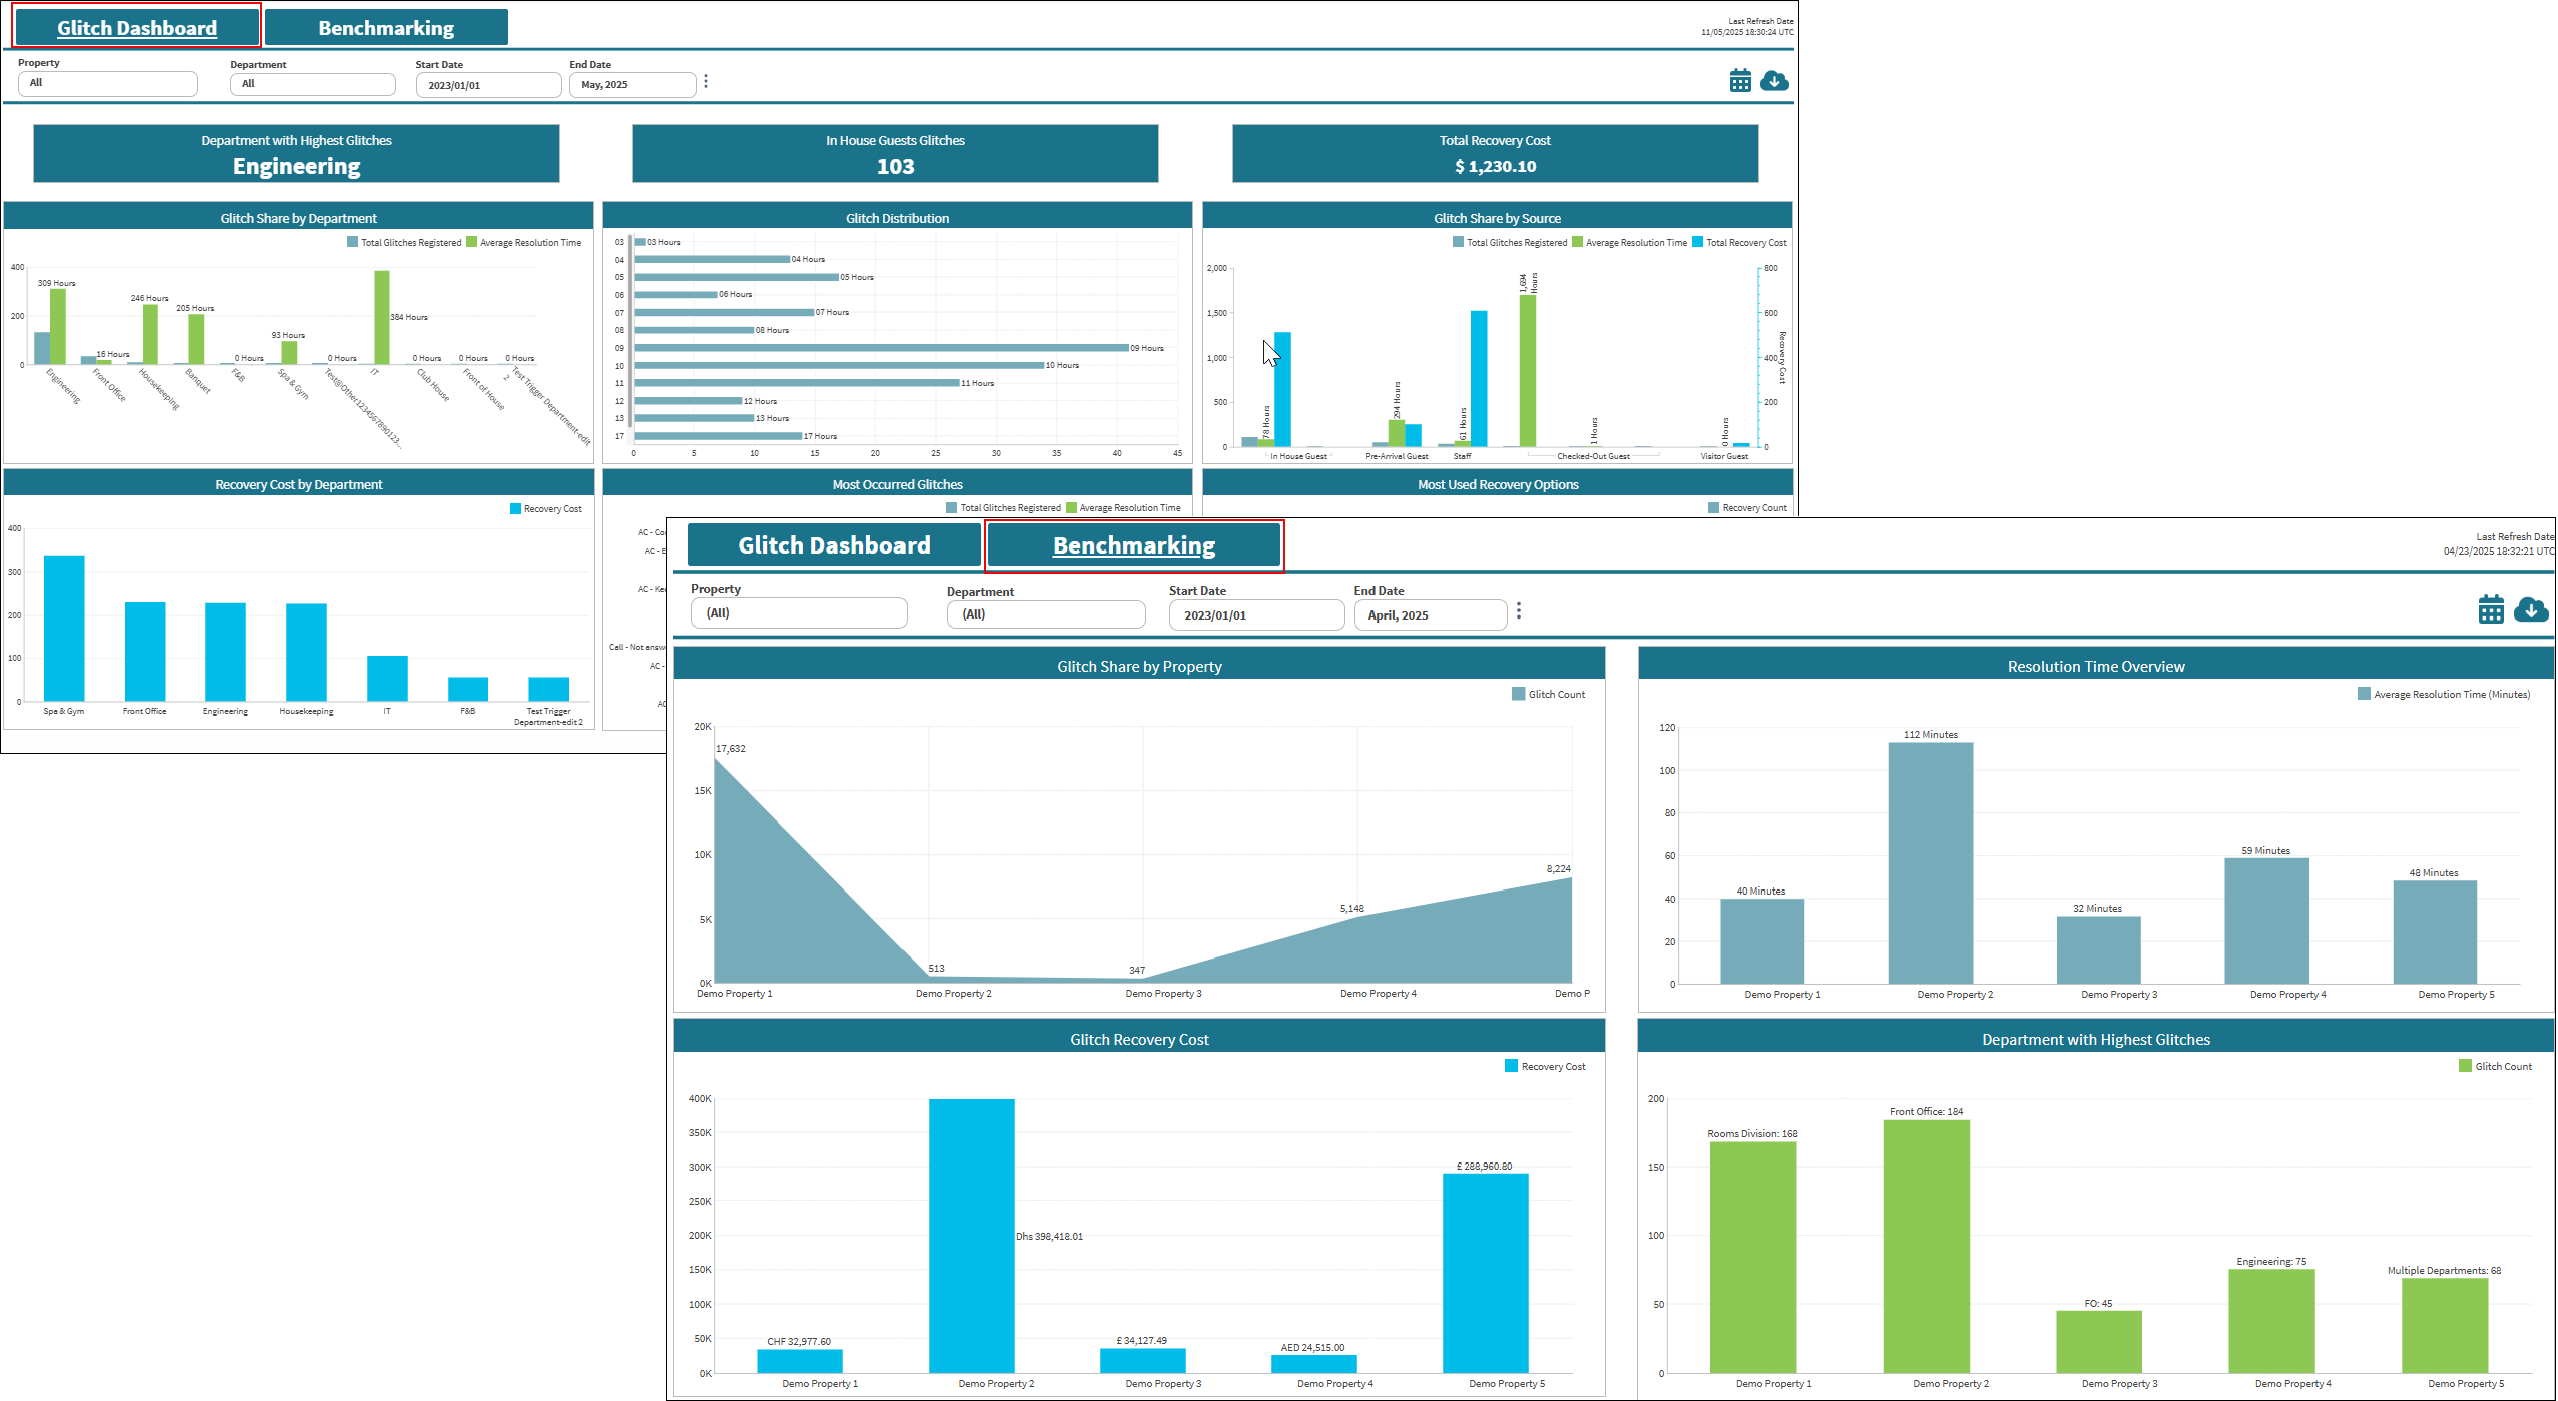
Glitch Analytics screen
Use the Glitch Analytics screen to monitor key service recovery metrics such as glitch volume, resolution time, recovery cost, and department-level issue trends. Glitch Analytics provides an interactive platform to track and analyze glitch data, offering valuable insights to improve operational consistency and guest satisfaction.
The Glitch Analytics screen includes two separate tabs:
-
Glitch Dashboard tab—You can track glitch performance metrics using standardized widgets, including glitch share by property, resolution efficiency, recovery cost, and department-level issue concentration. Customizable charts and filters allow for flexible data analysis and deeper operational insights.
-
Benchmarking tab—Compares property performance based on glitch data, focusing on key metrics like issue volume, resolution speed, recovery cost, and department-level trends across properties of different sizes using percentage-based data. The Benchmarking tab helps identify performance gaps and set improvement goals based on service recovery standards.