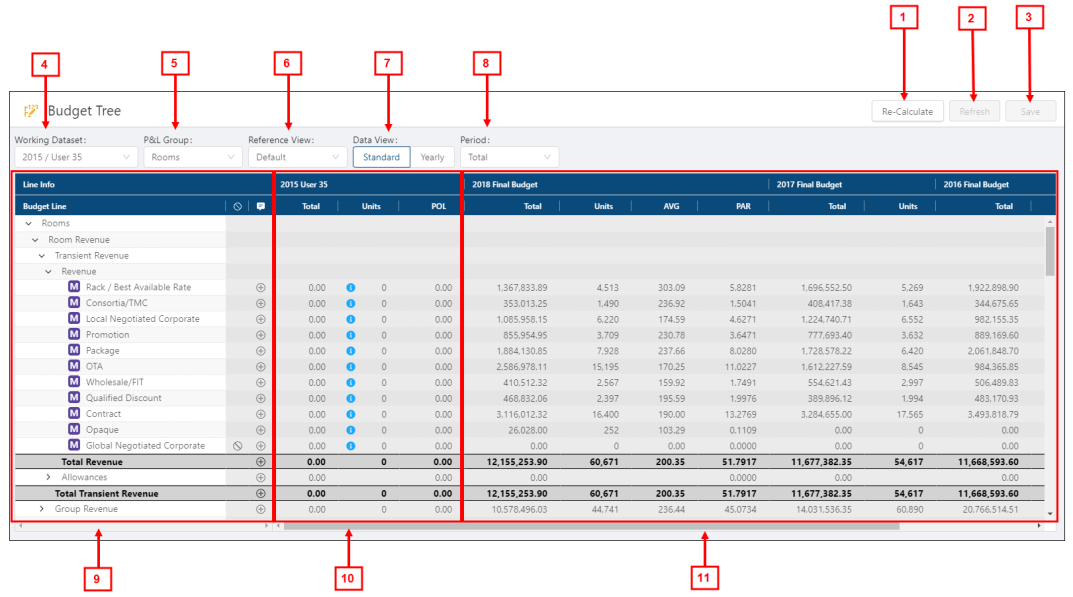
Budget Tree screen in Budgeting
The Budget Tree screen displays all of your organization's P&L Department revenue and expenses. Use this screen for managing the budget lines within your budget and for entering and reviewing your revenue and expenses.
Note: The main purpose of the Budget Tree screen is budget line management. To make structural changes or large-scale configuration changes to your budget, go to the Budget Structure screen. For example, if you need to add or move budget lines, you should go to the Budget Structure screen to make those changes.
For more information, see Budget Structure screen in Budgeting and Working with the Budget Structure.
Tip: If you want to change monetary amounts in the budget, use the Budget Tree screen. If you want to change budget structure and line configuration, use the Budget Structure screen.
See Working with the Budget Tree for instructions on the tasks performed from this screen.
Tasks performed from this screen

Note: The image above shows the Budget Tree screen with the Standard Data View selected.
Fields on the Budget Tree screen
| # | Field | Description | Notes |
|---|---|---|---|
|
|
Controls | ||
|
1 |
Re-Calculate / Import Actuals |
Re-Calculate—Recalculates your working dataset. Import Actuals—Opens the Import Actuals dialog box, where you select the P&L actuals dataset file to import. |
If Actuals is selected as the Working Dataset, the Re-Calculate button is replaced with the Import Actuals button. |
|
2 |
Refresh |
Contacts the database, pulls data from the last time you published, and then reverts the budget to the state of the last publication. |
|
|
3 |
Save |
Saves your changes to the database. For example, you will want to save the budget after you perform an hours and rate adjustment. |
This button is available only if you have edited a budget line. |
|
4 |
Working Dataset |
Change your working datasets. |
Default: Working dataset from the previous session. |
|
5 |
P&L Group |
Select the P&L group to work with. (You don't need to go back to the dashboard.) Select All to view all P&L groups. Important: Selecting all P&L groups will increase load, recalculation, and save times. Unifocus recommends only using this option to view data. Do not work in Budget Tree while viewing all P&L groups. |
Default: If you double-clicked a line in the Budgeting Dashboard, the Budget Tree opens to the P&L group line that you selected. Otherwise, the screen opens to the top level of your budget structure. If you exit the Budget Tree screen and then return during the same session, you return to your selected P&L group. |
|
6 |
Reference View |
Change your reference datasets, select a view., and specify the columns that appear in Budget Line section of the table. Tip: For best performance, Unifocus recommends selecting one to three reference datasets. |
Default: Your first configured reference view. The screen does not save the selected reference view from your previous session. You can change the default view. |
|
7 |
Data View |
Selects the time frame for which to view data. Options include:
|
Default: Standard view. If P&L Actuals is your working dataset, Yearly is the only available view. |
|
8 |
Period |
Select a financial period. |
This field appears only if the Standard view is selected. |
|
|
Table | ||
|
9 |
Budget Lines |
Tree menu of budget lines within your working dataset, which is organized by Budget Structure. Depending on your view configuration, the following columns are available:
|
Display or hide Notes, Account Code, and Inactive/Active Lines columns, in the Options tab of the Configure Views dialog box (Reference View > Add or Configure).
|
|
10 |
Working dataset |
Information for your working dataset, that is, the main budget that you are reviewing and editing. Lines with additional information display a blue information icon ( |
|
|
11 |
Datasets in the selected Reference View |
The datasets included in your selected reference view. A reference view can contain up to four reference datasets. There are two views:
Columns in Standard View include:
In Yearly view, the columns are grouped by financial periods. |
|
 ) next to the budget line. The inline note icon (