Daily Digest email for RMS 10
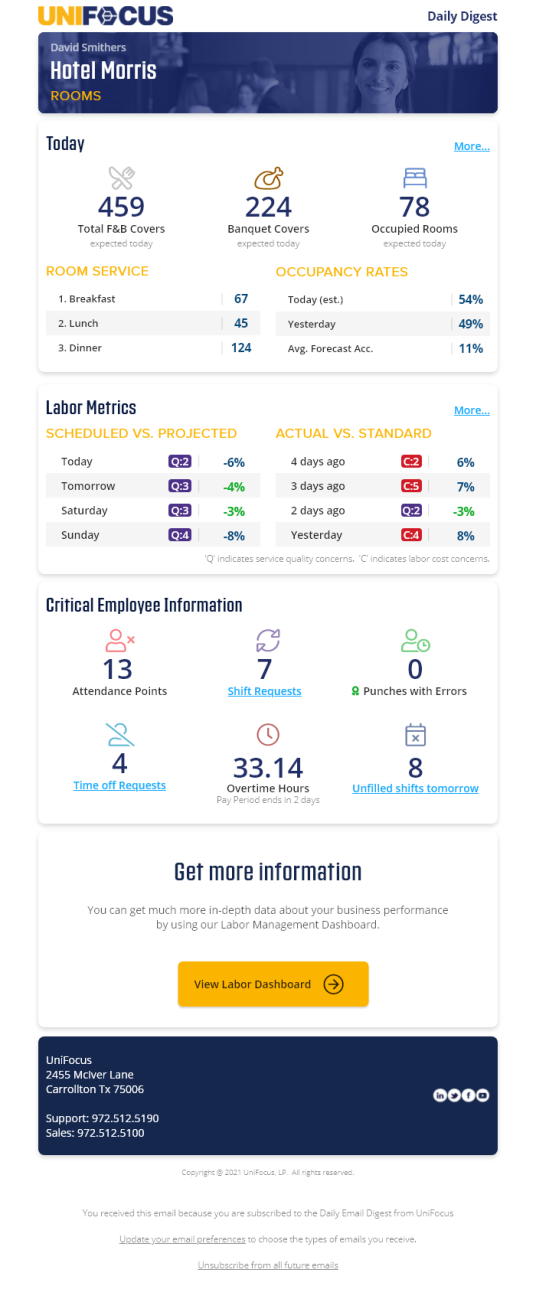
The Daily Digest is a daily email notification that provides an at-a-glance view of critical Labor and Time & Attendance data throughout your organization. The Daily Digest consolidates information from various RMS screens so that you have all the information needed to start your day delivered right to your inbox. If there are no issues that concern you, no further actions are required in RMS. If you notice an issue that requires your attention, selecting the links in each section of the email takes you to the relevant screen in the software. If you are using a desktop computer, RMS will launch, and the relevant screen opens. If you are using a mobile device and have a Unifocus Mobile App license, a mobile version of the relevant screen opens.
Go to the Labor Dashboard for more detailed information about the metrics presented in the Daily Digest email.
The Daily Digest email includes the following sections:
How to use this help page: For each section, you'll find a corresponding graphic and table that describe the metrics. The Data sources column lists the RMS screens that provide detailed information.
Note: This document provides an overview of a sample Daily Digest email. The sample email shown above contains all possible sections and metrics that can appear in the Daily Digest. Depending on your configurations and template, your email message might contain fewer sections, or data might appear in a different order than in the email shown above. Contact your Unifocus Client Success Manager (CSM) for more information on configurations and available templates.
Header

The top part of the email displays three key pieces of information:
-
The recipient's name.
-
The recipient's organization/company.
-
The labor structure levels to which the recipient has access.
This information is based on security permissions that are established in the User Administration screen.
Today
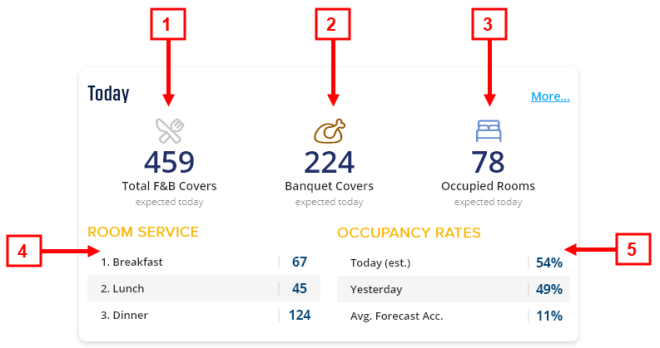
The Today section includes a combination of forecast, adjusted, and actual values that offers a snapshot of the day's covers and KBIs. This section displays only data to which users have access.
| # | Metric | Description | Data sources (Where you can find the data in RMS) |
|---|---|---|---|
|
1 |
Total F&B Covers |
Forecast total of covers from the Food & Beverage (F&B) division. Note: Total F&B Covers appears in the Daily Digest email only if you have access to viewing this data in RMS. |
|
|
2 |
Banquet Covers |
Forecast number of banquet covers. |
|
|
3 |
Occupied Rooms |
Forecast number of occupied rooms. |
|
|
4 |
Revenue center |
Data from the revenue center with the most covers. |
|
|
5 |
Occupancy Rates |
Data from the actual rates, manager-adjusted forecast, and system forecast. Average Forecast Accuracy is based on the past two weeks. Note: Depending on availability, the data is displayed in the following order: 1) actual rates, 2) manager-adjusted forecast, and 3) system forecast. |
|
Labor Metrics
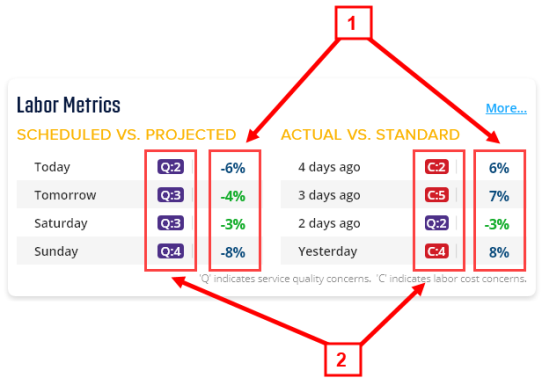
This section displays weekly metrics for hours variances.
| # | Metric | Description | Data sources
(Where you can find the data in RMS) |
|---|---|---|---|
|
1 |
Variance percentage |
Variance between:
Values in red are outside the configured threshold. Values in green are within the configured threshold. |
For Scheduled vs Projected:
For Actual vs Standard:
|
|
2 |
Quality and Cost |
|
|
Critical Employee Information
The data displayed in the Critical Employee Information comes from Review Pay Period, Employee Requests, Employee Schedules, and Attendance Points and Events screens. This section displays only data to which users have access.
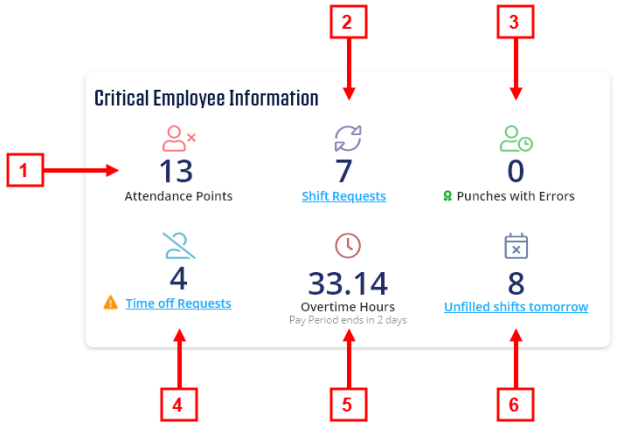
The icon of the exclamation point in the orange triangle ( ![]() ) indicates that there are issues or concerns with the value. The green ribbon icon (
) indicates that there are issues or concerns with the value. The green ribbon icon ( ![]() ) indicates optimal performance.
) indicates optimal performance.
| # | Metric | Description | Data sources
(Where you can find the data in RMS) |
|---|---|---|---|
|
1 |
Attendance Points |
Total number of points associated with employees' adherence to or violation of attendance policies. This total is for the current pay period. |
|
|
2 |
Shift Requests |
Total number of pending employee shift requests. |
|
|
3 |
Punches with Errors |
Total number of punches with unresolved errors. |
|
|
4 |
Time Off Requests |
Total number of pending employee time off requests. |
|
|
5 |
Overtime Hours |
Sum of actual overtime hours based on the current, active pay period. |
|
|
6 |
Unfilled Shifts Tomorrow |
Total number of unfilled (or open) shifts tomorrow. |
|
Get more information
Select Visit your Labor Dashboard ( ![]() ) to open the Labor Dashboard in RMS.
) to open the Labor Dashboard in RMS.

