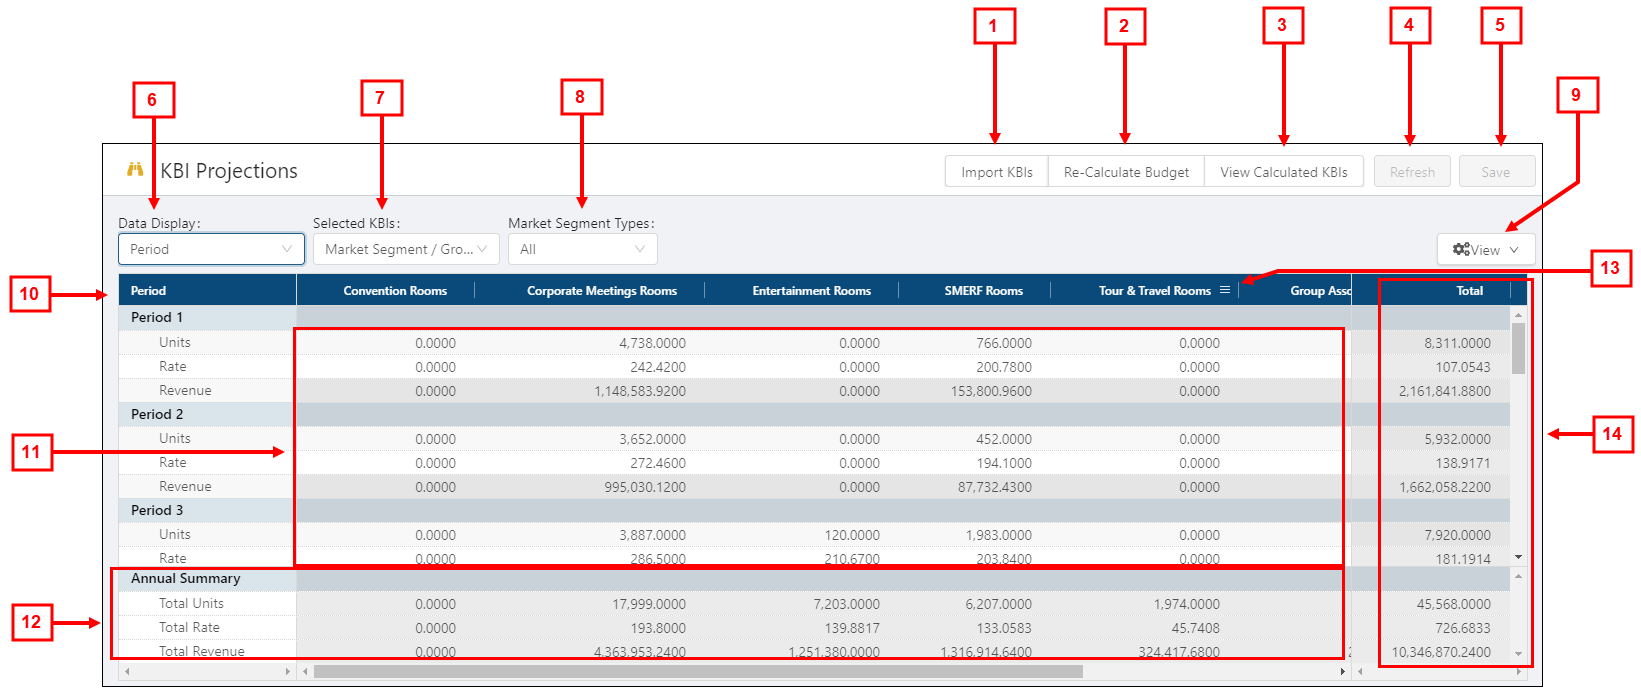
KBI Projections screen in Budgeting
Key Business Indicators (KBIs) allow you to forecast units to determine a revenue amount. In Unifocus software, KBIs are necessary for generating labor, certain types of revenues, and other key drivers (for example, the number of cars parked or the number of spa treatments). Use the KBI Projections screen to do the following:
-
View and import KBIs that affect your budget.
-
Forecast any KBI that consists of a unit and an average rate to determine revenue.
-
Budget all of your revenues and all of your units that are used in the Labor module of Unifocus RMS.
This screen serves the same purpose as the Import Forecast KBIs pane in the Labor module of RMS, but it enhances that functionality by allowing you to budget your revenues.
Note: Although KBIs on the KBI Projections screen can be edited, the main purpose of the screen is to review KBIs after imports and recalculations to ensure accuracy. As a best practice, KBIs should be configured and edited in the Forecast Structure screen.
Note: The values on this screen carry over to the Budget Tree screen in Budgeting. In the Budget Tree screen, if you double-click a Market Segment (  ) or a Revenue Center (
  ) line type, you cannot edit the Cost Structure & Results tab of the Edit Budget Line dialog box. However, the unit values still carry over for KBI line type, so you can edit the cost structure.
Important: You can complete other budgeting tasks without first completing KBI projections; however, you will not be able to finalize your budget until you complete KBI projections.
Tasks performed from this screen

Fields on the KBI Projections screen
| # | Field | Description | Notes |
|---|---|---|---|
|
|
Controls | ||
|
1 |
Import KBIs |
Imports KBIs from an external system. |
This option is available only if the Import Budget Forecast KBIs interface is configured. |
|
2 |
Re-Calculate Budget |
Recalculates your working dataset. |
|
|
3 |
View Calculated KBIs |
Opens the View Calculated KBIs dialog box where you can view all calculated KBIs. |
|
|
4 |
Refresh |
Contacts the database, pulls data from the last time you published, and then reverts the budget to the state of the last publication. Important: Use only this refresh button for the budgeting operation. Selecting the browser refresh button will refresh all open RMS tabs, which could result in unsaved data or lost changes. For more information, see Refreshing screens |
This button is available only if you have made changes to the screen. |
|
5 |
Save |
Saves your changes to the database. |
This button is available only if you have made changes to the screen. |
|
6 |
Data Display |
Selects the time frame for which to view data. Options include:
|
By default, the Period view is selected and opens to the first division or property sorted in alphabetical order. Your selected data display is saved for your session, so if you go to another screen and then return to the KBI Projections screen, the data is displayed in the previously selected time frame. |
|
7 |
Selected KBIs |
Select market groups that contain one or more KBIs to display. |
Both the default option and the drop-down list options depend on your user security permissions to see KBIs. |
|
8 |
Market Segment Types |
Select available market segment types to display on the screen. You can select all market segment types or all segments types. |
Default: All. If you do not have access to market segments, this field does not appear. |
|
9 |
View |
Selects which units, rates, or revenue appear in the table. Selected check boxes display the row; cleared check boxes hide the row. Options include:
|
|
|
|
Table | The table view is customizable and depends on your selections from the fields at the top of the screen. |
|
|
10 |
Time frame for data display |
The information in the table appears based on the selected data display type. |
|
|
11 |
KBIs and market segment types |
KBI and market segment amounts based on your display selections. If you enter values in these cells, the amount is distributed appropriately for your selected data display. For example, if you are using an annual data display and enter a value of 365 (based on a 365-day calendar year), the value is distributed as 1 per day in a daily data display. |
Column headers correspond with configured KBIs. |
|
12 |
Annual Summary |
Displays annual summary of Total Units, Total Rate, and Total Revenue. |
Read-only. The information that appears in the section depends on your selection from the View menu ( |
|
13 |
Column filters |
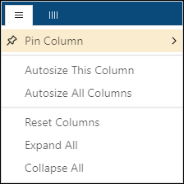
Control, customize, and filter the information for table columns.
For more information, seeUsing column settings in the KBI Projections screen. |
Column filters are saved only for your current session. They are not saved for other sessions or other users. |
|
14 |
Total |
This section displays the totals for all KBIs and market segments selected in the filtered view based on the selected data view (Annual, Quarter, Period, or Daily). |
Read-only. |

